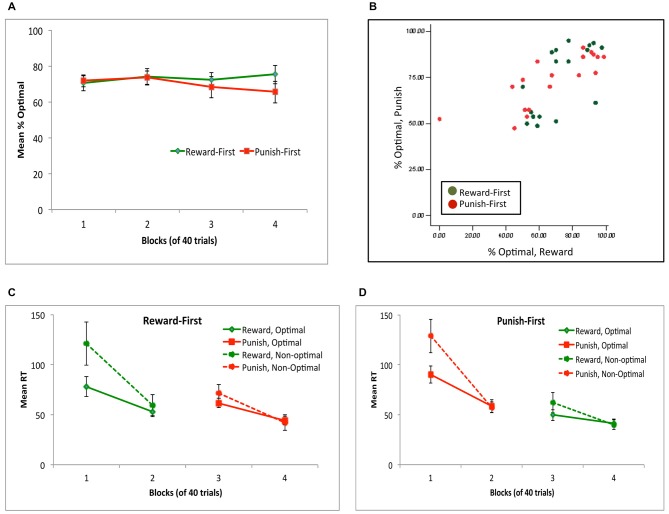
Figure 8.
(A) Performance across the four blocks, for subjects in the Reward-First and Punish-First conditions of Experiment 2. (B) Individual subject data, plotted as percent optimal responding on reward-based and punishment-based trials. (C,D) Mean reaction time (RT) in ms for subjects in the Reward-First (C) and Punish-First (D) conditions, shown separately for trials where the optimal and non-optimal response was given.

