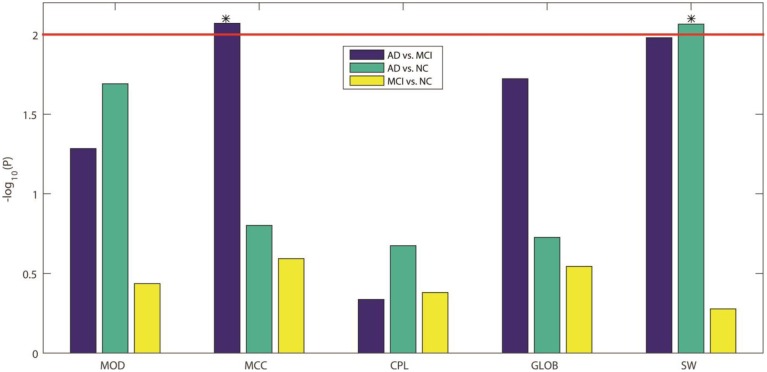
Figure 5.
−log10(P) values from our three inter-group comparisons using Student's t-test for each of five standard global network measures. From left to right, the five network measures are: MOD, modularity; MCC, mean clustering coefficient; CPL, characteristic path length; GLOB, global efficiency; and SW, small worldness, respectively. The colors indicate which groups are being compared: blue for AD vs. MCI, green for AD vs. NC, and yellow for MCI vs. NC. Bonferroni correction was used to account for multiple comparisons, so the adjusted threshold is 2, indicated by the red line in the figure. Only values above the line are statistically significant given this threshold. Our results show that only MCC can differentiate AD from MCI and only SW can differentiate AD from NC.

