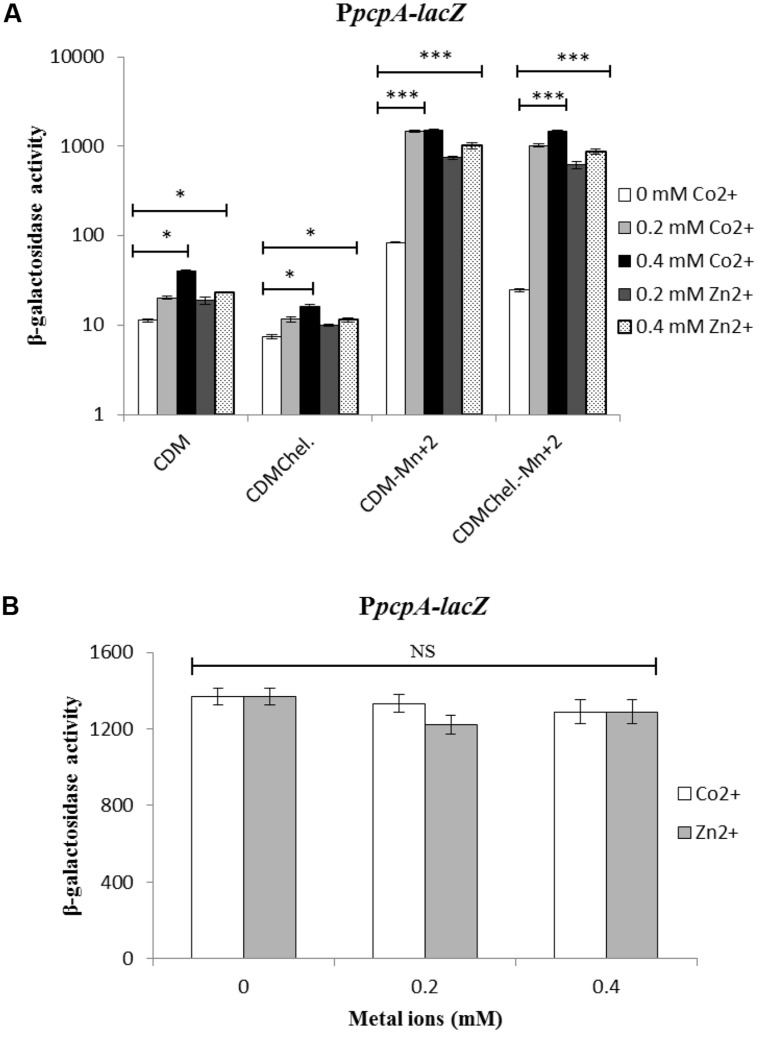
FIGURE 2.
(A) Expression level (in Miller units) of PpcpA-lacZ in D39 WT in CDM, CDM-Mn2+, CDMchelex, and CDMchelex-Mn2+ supplemented with different concentrations of Co2+ and Zn2+. (B) Expression level (in Miller units) of PpcpA-lacZ in ΔpsaR strain. SD of three independent replications is indicated with error bars. Statistical significance of the differences in the expression levels was determined by one-way ANOVA (NS, not significant, ∗P < 0.05, and ∗∗∗P < 0.0001).

