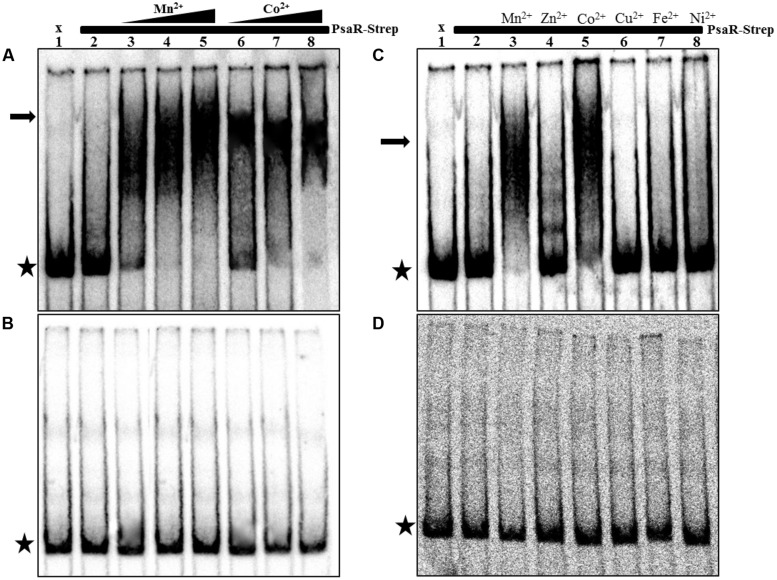
FIGURE 4.
In vitro interaction of PsaR-Strep with the promoter region of pcpA. PsaR-Strep was added at concentration of 30 nM as indicated with horizontal bar above the lanes, while lane 1 is without protein. Arrows indicate the position of the shifted probe and asterisks indicate the position of the free probe. (A) Mn2+ was added in concentrations of 0.05 mM, 0.1 mM, and 0.2 mM as indicated by the triangular bar above lanes 3, 4, and 5. Co2+ was added in concentrations of 0.05 mM, 0.2 mM, and 0.4 mM as indicated by the triangular bar above lanes 6, 7, and 8, respectively. (B) The same experiment was done as described in (A), except that now 100 mM EDTA was added. (C) Metal ions were added as indicated above the lanes in concentrations of 0.2 mM. (D) The same experiment was done as described in (A), except that PadcR was used (negative control) instead of PpcpA.

