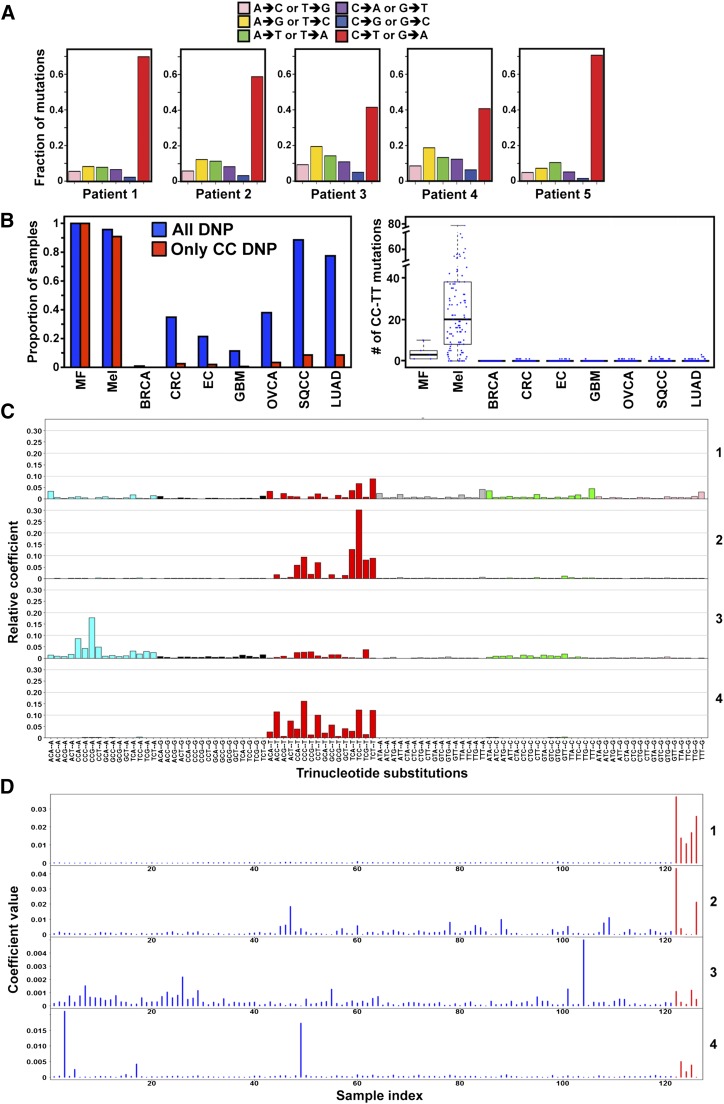
Figure 2.
Mutations in MF appear to have a UV signature. (A) Frequency of different mutation classes in each MF patient. (B) Samples with any DNP and with mutations that specifically change CC in different cancer types (left). The number of CC:GG to TT:AA mutations in the coding regions of each cancer type (right). BRCA: breast cancer, n = 507; CRC: colon and rectal cancer, n = 224; EC: endometrial carcinoma, n = 248; GBM: glioblastoma, n = 290; LUAD: lung adenocarcinoma, n = 182; Mel: melanoma, n = 121; OVCA: ovarian carcinoma, n = 316; SQCC: squamous cell lung cancer, n = 177. (C) Four mutation signatures of MF and melanoma tumors. Each color denotes 1 of the 6 possible trinucleotide mutations. The y-axis denotes the relative coefficient of each substitution to the corresponding signature. (D) Coefficient of each MF (red) and melanoma (blue) tumor for each signature. The sample index for melanoma is x = 1:121 and MF is x = 122:126. A higher coefficient indicates a higher contribution of the corresponding signature in the sample. Only SNVs not in dbSNP (build 131) or the 1000 Genome Project (November 2010) were included.

