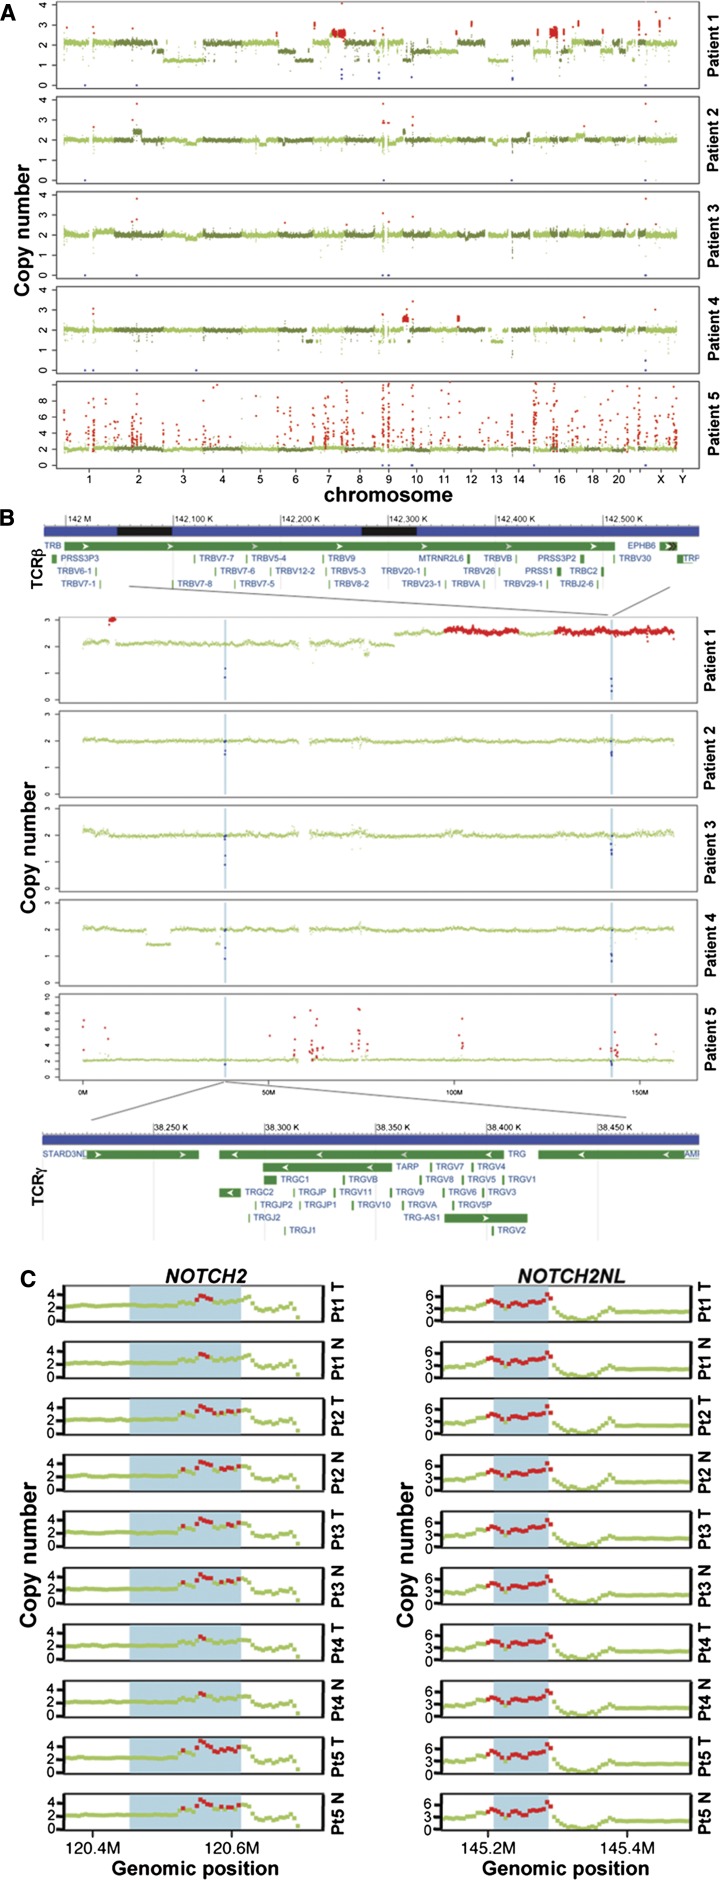
Figure 4.
Copy-number alterations in MF tumor genomes. (A) FREEC detection of SCNAs in each patient. X-axis: genomic positions, ordered by chromosomes. Y-axis, copy numbers in tumor compared with the matched normal sample. A copy number of 2 indicates copy number neutral; red: gains, blue: losses, green: no change. (B) Deletion regions on chromosome 7 that involve T-cell receptor genes (annotations are based on human reference GRCh37/hg19); TRB: T-cell receptor β locus. TRG: T-cell receptor γ locus. (C) Amplification at the NOTCH2 and NOTCH2NL loci in normal (N) and tumor (T) of each patient (Pt). Red dots: copy number ≥3. The blue shade shows the respective gene region: NOTCH2 (chr1:120454176-120612317) and NOTCH2NL (chr1: 145209111-145285912) based on UCSC Genome Browser hg19. A copy number of 2 is neutral.

