
Figure 5. Classification and regression tree (CART) model MAS treatment outcome (response AHI < 10, definition 2).
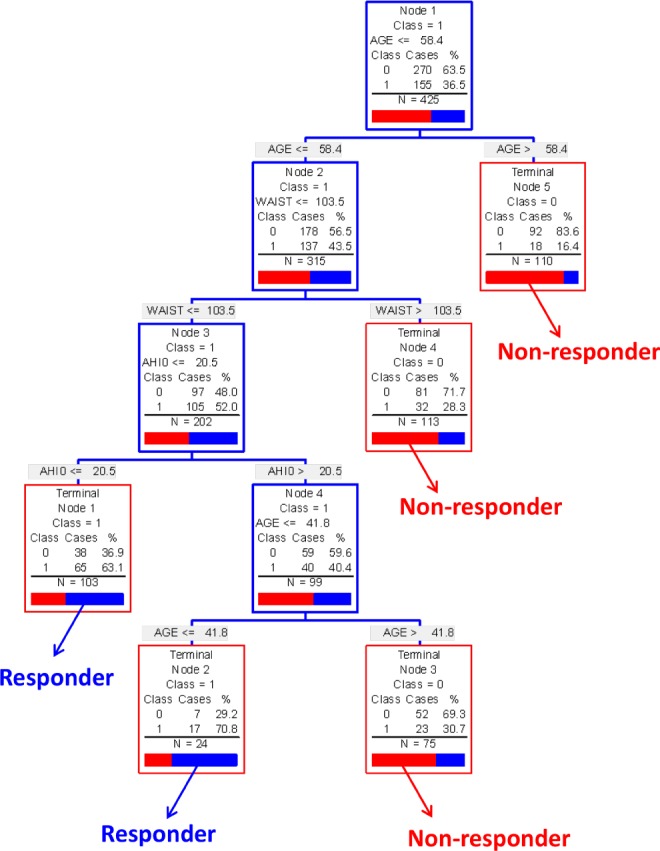
The modelling process starts with the entire patient sample (top blue box). The group is then sequentially split using the variable and cut-point which correctly classifies the maximum number of patients as either responders or non-responders. When no more splits can be made the patients are left in a “terminal node” (red box) where they can be classified as either responders or non-responders based on the predominant classification of patients in that terminal node. The proportion of responders (blue or “1”) and non-responders (red or “0”) in each terminal node is shown. Predictive variables were age, neck circumference (NECK), and waist circumference (WAIST). This model correctly classified 64% or patients on MAS treatment outcome. Non-predictive variables considered in model: baseline AHI, gender, BMI, sleep stage, and body position OSA phenotype.