
Figure 3. Two conceptualizations of sleep duration.
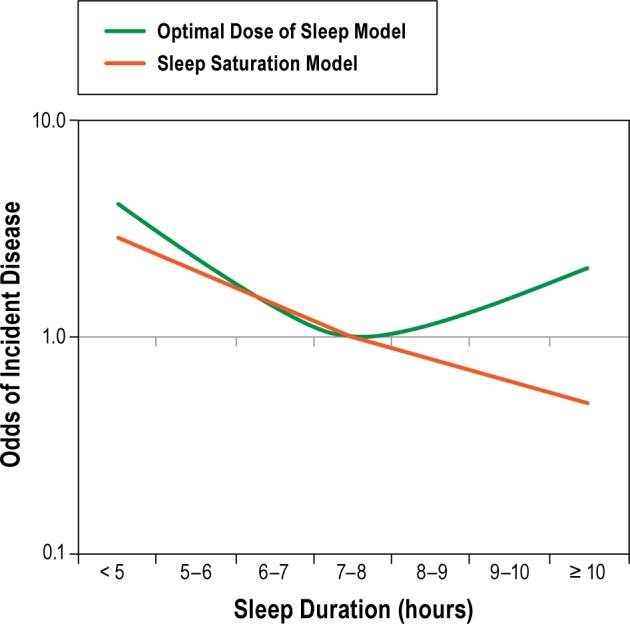
Adapted with permission from Marshall et al. Sleep Med Rev 2008;12:289–298. The green line represents an optimal dose of sleep where the odds of incident disease are lowest. The orange line represents a sleep saturation model, where longer sleep is not necessarily associated with poor health, and may be beneficial in some circumstances (e.g., recovery from sleep deprivation or illness).