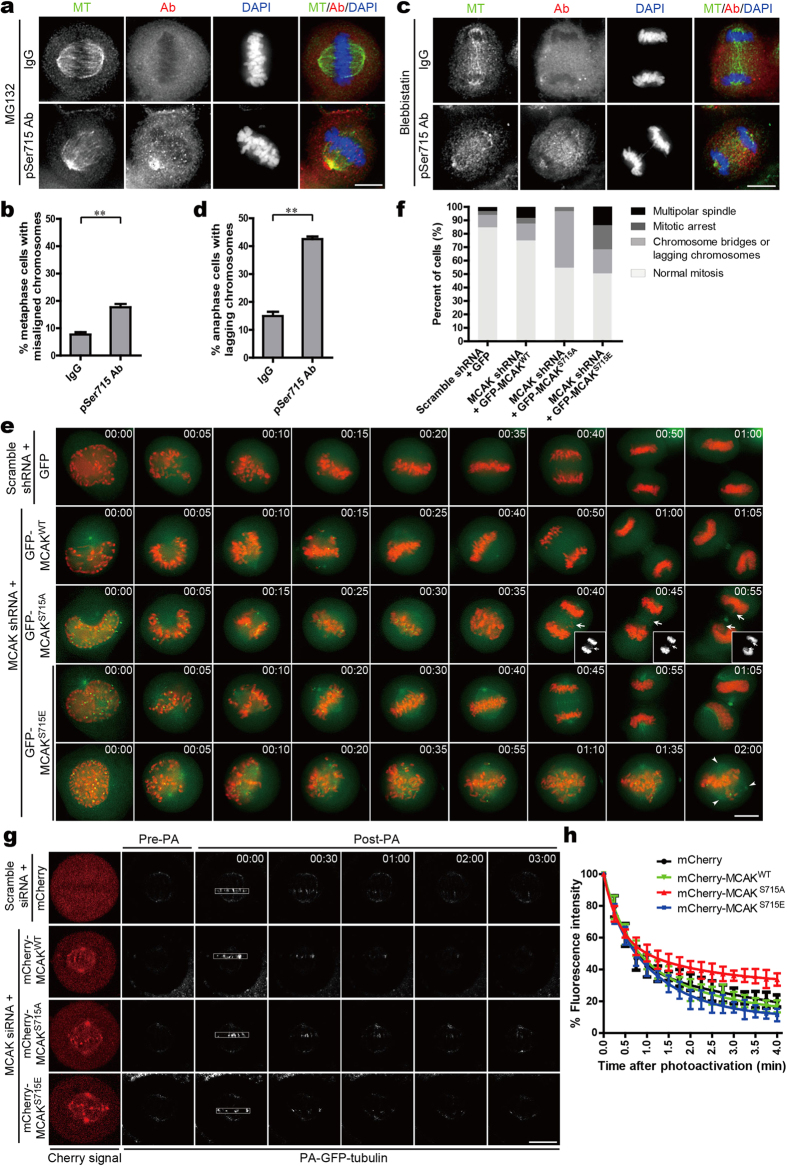
Figure 4. Perturbation of MCAK phosphorylation on Ser715 causes defects in chromosome segregation.
(a) Images of metaphase cells upon introduction of pSer715-MCAK antibody. Double thymidine-blocked HeLa cells were released and electrotransfected with pSer715-MCAK antibody or control IgG. Cells were then arrested at metaphase by MG132 treatment for 1 hr, followed by fixation and immunofluorescence with a goat anti-rabbit rhodamine-conjugated secondary antibody to highlight the pSer715 antibody in cells. (b) Statistical analysis of metaphase cells with misaligned chromosomes seen in (a). Data are presented as means ± SD from three independent experiments. **P < 0.01, Student’s t-test. (c) Images of anaphase cells injected with pSer715-MCAK antibody. HeLa cells were treated as described in (a) except that cells were synchronized in anaphase by Blebbistatin (a small molecule inhibitor of Myosin). (d) Statistical analysis of anaphase cells with chromosome bridges or lagging chromosomes seen in (c). Data are presented as means ± SD from three independent experiments. **P < 0.01, Student’s t-test. (e) Live-cell imaging of chromosome movements in HeLa cells co-transfected with GFP-MCAK constructs and mCherry-H2B-marked MCAK shRNA. At 48 hr post-transfection, cells were observed with a DeltaVision microscopy system for two hours. Arrows indicate lagging chromosomes during segregation. Arrowheads indicate multiple spindle poles. Time is annotated as hr:min. (f) Quantitative analysis of mitotic phenotypes seen in (e). Data are derived from over 30 cells for each category. (g) Time-lapse imaging of metaphase spindle dynamics in MCAKWT-, MCAKS715A- or MCAKS715E-expressing cells. HeLa cells depleted of endogenous MCAK by siRNA were co-transfected with PA-GFP-tubulin and mCherry-MCAK. Cells were synchronized in metaphase and imaged before (Pre-PA) and after photoactivation (Post-PA). Time is shown as min:sec. (h) Fluorescence intensity over time after photoactivation in (g). GFP intensity in the activated region was calculated and normalized to the first time-point after photoactivation. Data are represented as means ± SD and derived from over 10 cells for each condition. Scale bars, 10 μm (in all image panels).

