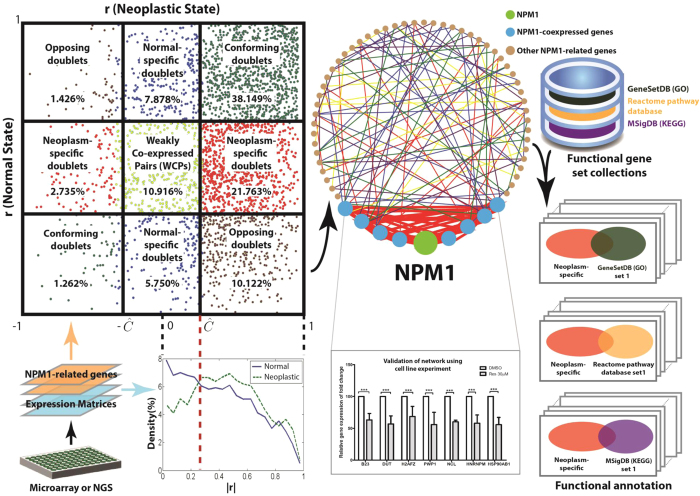
Figure 1. Overview of the proposed co-expression structural analysis strategy, experimental validation and functional annotation analysis.
The colours of the points in the co-expression galaxy correspond to those of the lines in the co-expression networks. Red and blue colours represent neoplasm-specific and normal-specific doublets respectively. The red ellipse in functional annotation embraces a set of neoplasm-specific doublets as its items.

