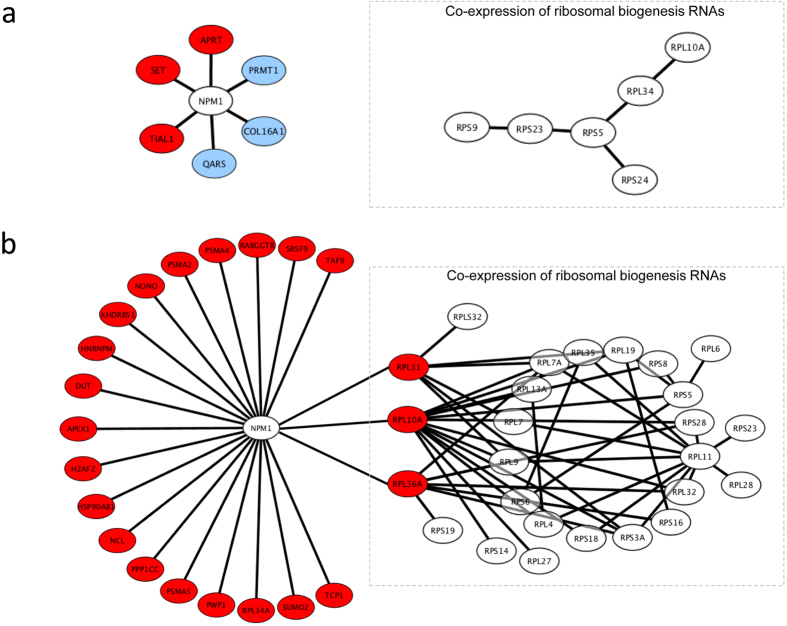
Figure 3.
Co-expression networks of NPM1-doublets and RPs that were specifically found in (a) normal and (b) CML co-expression structures. Red circles represent RNAs positively correlated with NPM1, and blue circles represent RNAs negatively correlated with NPM1. RP co-expression networks are shown in dashed boxes. RPL31, RPL10A and RPL36A were hubs that connected RP network to NPM1 in CML.

