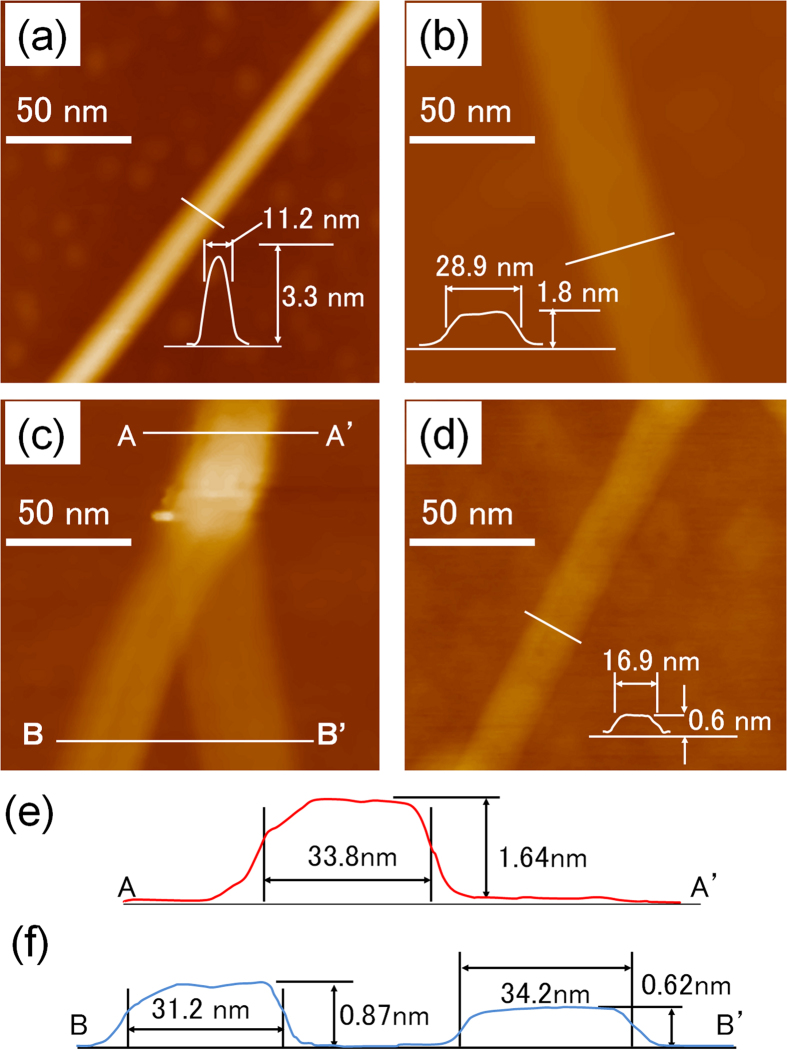
Figure 2.
AFM images of (a) a DWNT used as the starting material, (b) a dGNR obtained by the unzipping of the DWNT, (c) the region at which the dGNR splits into two sGNRs, (d) a resulting sGNR. Each scale bar is 50 nm. (e) Line profile of the dGNR in (c), obtained along the line A-A′. The height and width of the dGNR are 1.64 nm and 33.8 nm, respectively. (e) Line profile of the dGNR in (c), obtained along the line B-B′. The height and width of the sGNR on the left are 0.87 nm and 31.2 nm, respectively, and those of the sGNR on the right are 0.62 nm and 34.2 nm, respectively. The insets in (a,b,d) show the height profile along the white line in each case. The images (a–d) correspond to different samples.

