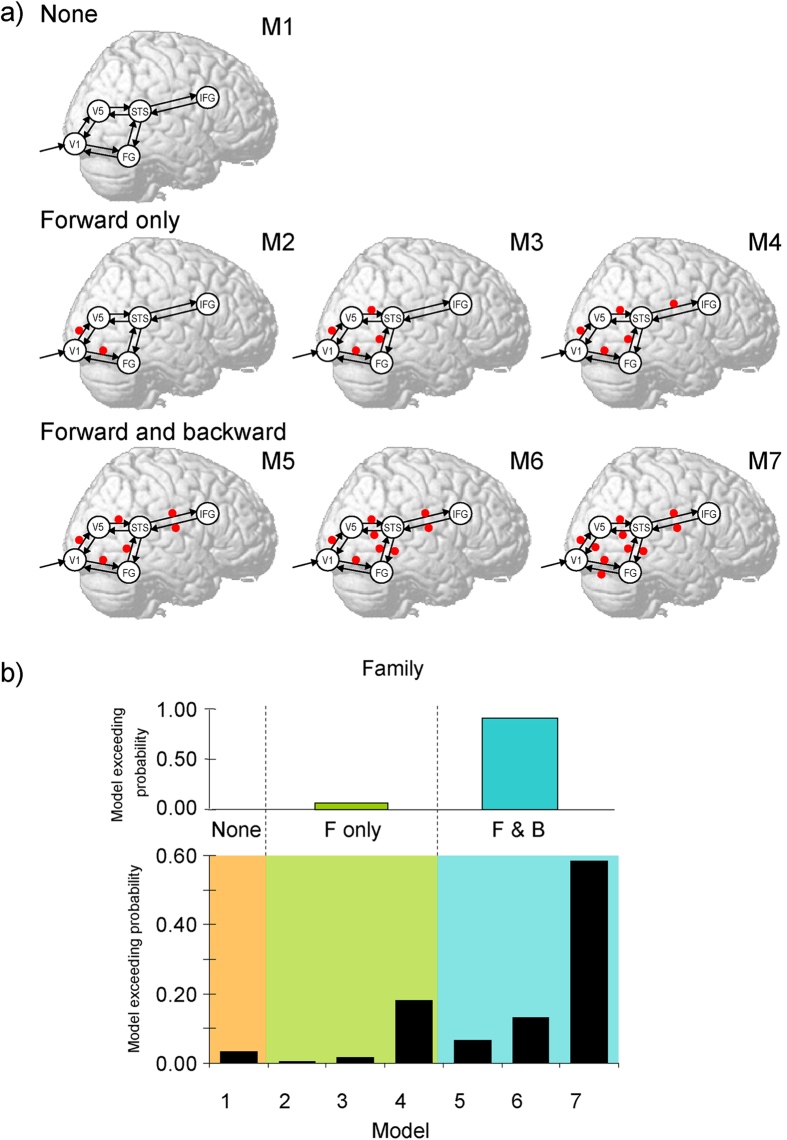
Figure 2. Models and results of dynamic causal modeling.
(a) Analyzed model. Arrows indicate intrinsic connections between brain regions. Red points indicate the possible locations of the modulatory effect of dynamic facial expression. Candidates included the models with modulatory effects on no connection (upper), only forward connections (middle), and both forward and backward connections (lower). (b) Exceedance probabilities of models (upper) and model families (lower: none, forward [F] alone, forward and backward [F&B] in Bayesian model selection).

