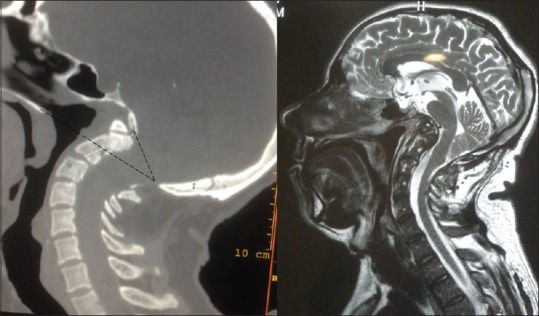
Figure 3.

Type 2 Basilar Invagination. At left, CT scan. Lower black line represents Chamberlain's Line (CL). Upper line represents foramen magnum line. Black arrow is inserted in the C2 axis. The Odontoid above CL is the amount of odontoid CL violation
