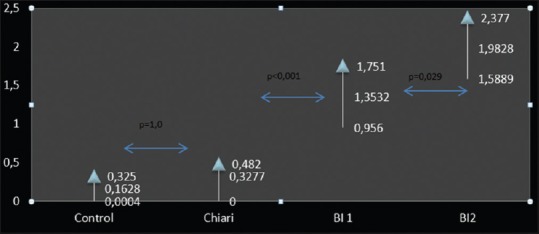
Figure 7.

The Chamberlain's line violation by odontoid process in Control group, Chiari malformation, Basilar type1 (BI1) and Type 2 groups (BI2). Upper and lower values are the 95% confidence limit values and the median value is the media of sample values
