
Figure 3. The identified proteins were assigned to eleven different cellular/subcellular localizations and to seven different functional processes by using the Protein Knowledgebase UniProtKB.
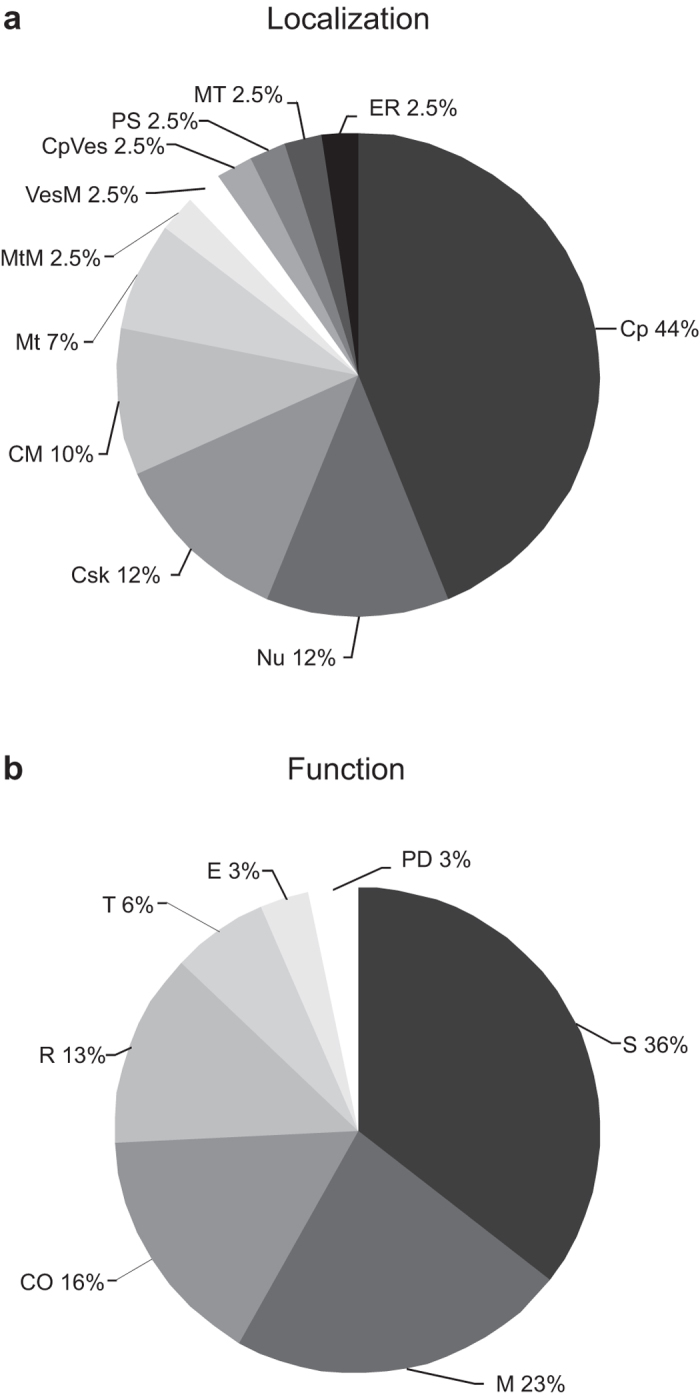
Pie charts represent the percentage of each localization (A) or functional (B) process entry with respect to the total number of entries. Same abbreviations as in Table 1.