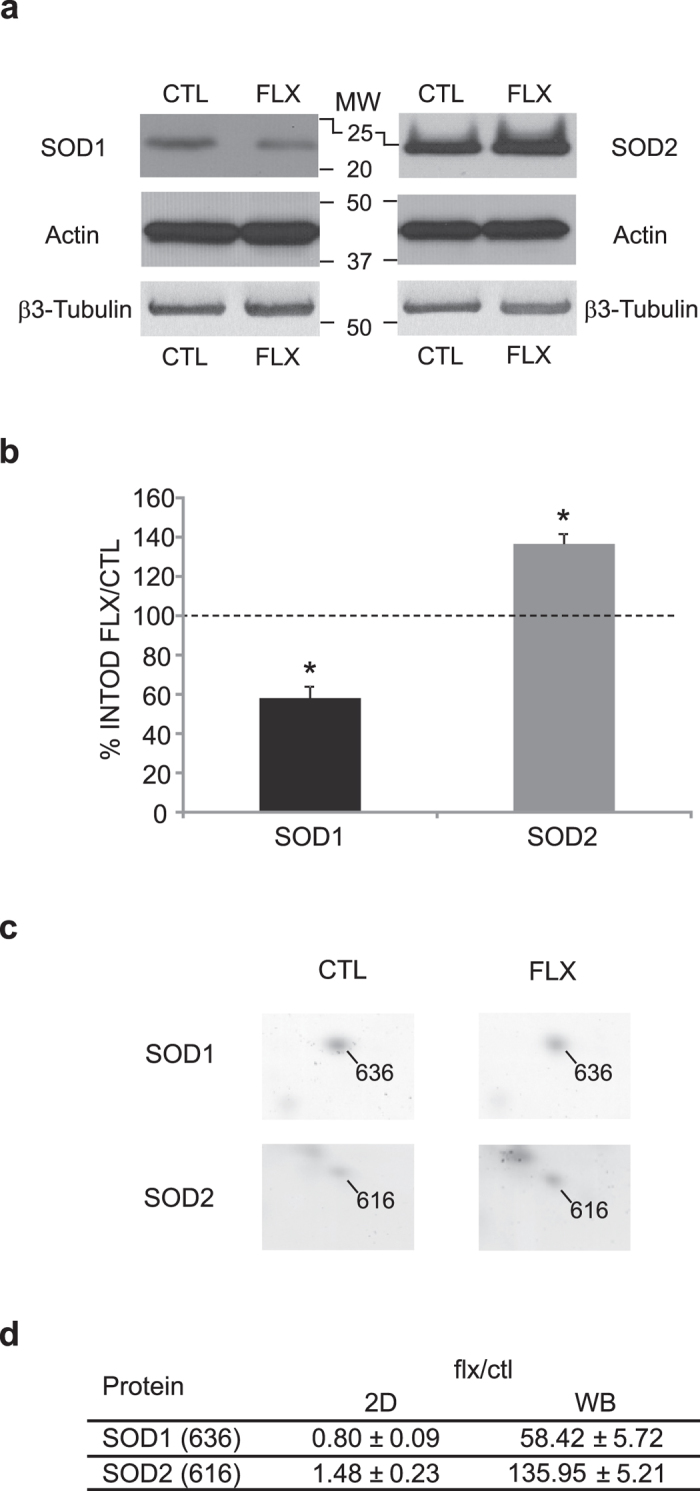
Figure 4. Validation of 2D gels protein level differences by western blot analysis.

A) Representative western blot of visual cortical samples from fluoxetine-treated (FLX) and age-matched controls (CTL) incubated with anti-SOD1, anti-SOD2, anti-actin or anti-β3-tubulin antibodies. Antibodies recognized a main band at 20–22 kDa (SOD1), 25kDa (SOD2), 42 kDa (actin) or 55 kDa (β3-tubulin). To improve the clarity of the presentation blot images were cropped. Larger images of the same blots are presented in Supplementary Figure F2. B) The SOD1 and SOD2 INTOD values were normalized to the corresponding actin value, and fluoxetine-treated values normalized to the corresponding value in control samples. SOD1 protein level decreased of approx. 40% in the visual cortex of fluoxetine-treated mice when compared to controls (SOD1: INTOD flx/ctl = 58.42 ± 5.72, Mann-Whitney U test, p < 0.05, n = 6), while SOD2 protein level increased approx. 35% (SOD2: INTOD flx/ctl = 135.95 ± 5.21, n = 6, Mann-Whitney U test, p < 0.05). Normalization against β3-tubulin values did not differ from what obtained with actin (SOD1: INTOD flx/ctl = 64.66 ± 13.54, n = 4, Mann-Whitney U test, p < 0.05; SOD2: INTOD flx/ctl = 141.13 ± 6.96, n = 4, Mann-Whitney U test, p < 0.05). C) Detail of the 2D gel electrophoresis indicating the spots corresponding to SOD1 (636) and SOD2 (616) in fluoxetine-treated (FLX) and age-matched controls (CTL). D) The table reports the amount of modulation of SOD1 and SOD2 protein level by fluoxetine as calculated in the 2D gel image analysis (2D gel) and in the western blot analysis (WB), with corresponding S.E.M.
