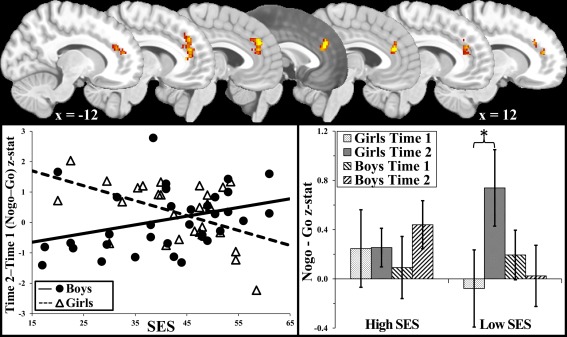
Figure 3.

Socioeconomic status and gender moderate change over time in NoGo versus Go brain activation. ACC, anterior cingulate cortex; SES, socioeconomic status. Top figure illustrates the cluster in anterior cingulate cortex in which socioeconomic status (SES) was negatively related to increased NoGo versus Go activation over time only in girls (visualized at sequential sagital slices every 4 mm, going from x = −12 to 12). The scatterplot visualizes the relationship between SES and change in activation seperately for girls and boys. The bar graph further breaks down the interaction, illustrating the level of activation for higher and lower SES (median split) girls and boys seperately for times 1 and 2. The error bars represent ± standard deviation. [Color figure can be viewed in the online issue, which is available at http://wileyonlinelibrary.com.]
