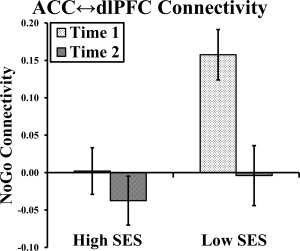
Figure 4.

Socioeconomic status moderates connectivity between anterior cingulate and dorsolateral prefrontal cortex during NoGo in girls. Note: ACC, anterior cingulate cortex; dlPFC, dorsolateral prefrontal cortex; SES, socioeconomic status. The graph illustrates the level of connectivity in girls between the ACC cluster that showed increased activation over time in lower SES girls and one of the dlPFC clusters that evidenced the main effect of NoGo versus Go. For visualization purposes, the graph shows connectivity for the NoGo period on the y axis, but this pattern holds when compared to the Go baseline. The error bars represent ± standard error of the λ's.
