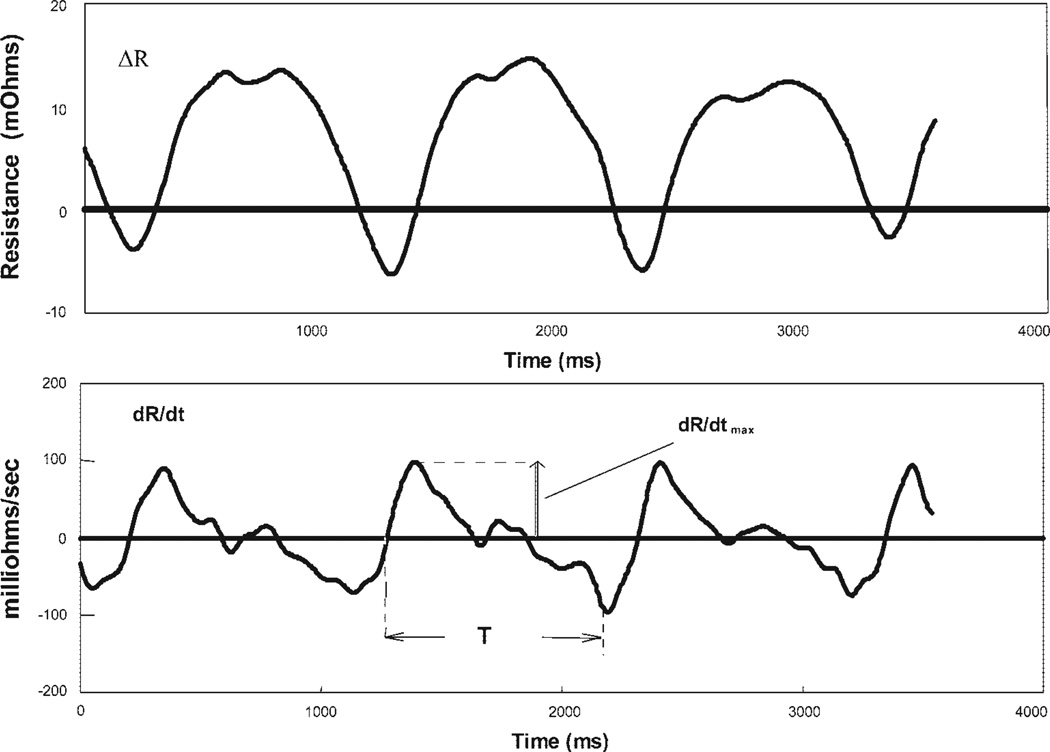
Fig. 1.
Thoracic impedance plethysmography traces obtained after filtering with a 6-pole Butterworth filter. Top: change in resistance (ΔR) as a function of time (t). Bottom: ∂R/∂t vs. time. Ejection time T and maximum change in resistance with time (∂R/∂tmax) are indicated. Blood flow is calculated as , where HR is heart rate, ρ is the electrical conductivity of blood, L is the segment length, T is ejection time, and R0 is baseline electrical resistance.

