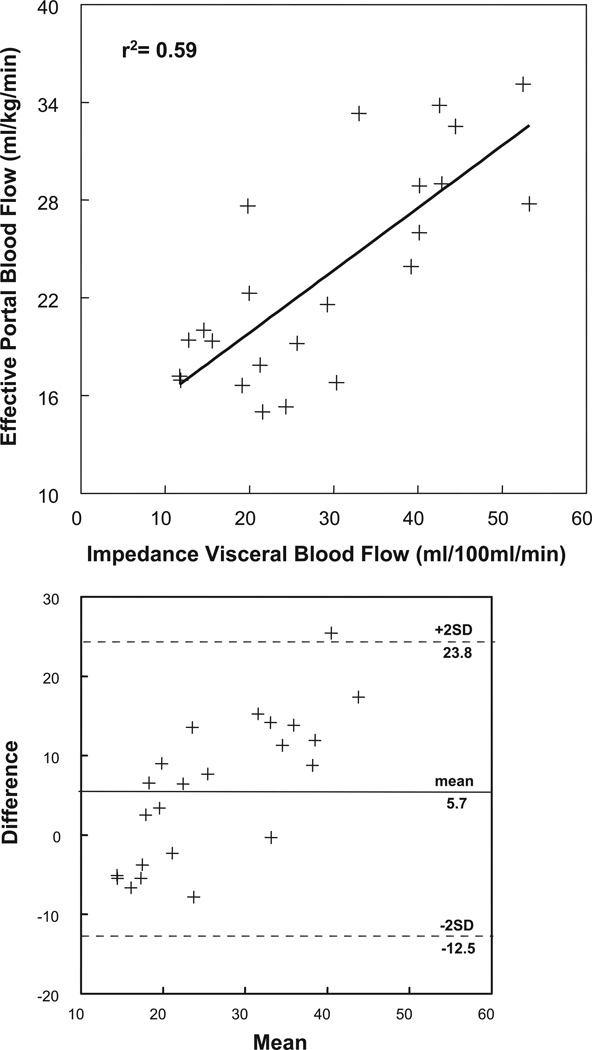
Fig. 3.
Top: splanchnic blood flow estimated by impedance plethysmography (x-axis) compared with splanchnic blood flow estimated by indocyanine green (ICG) dye dilution technique (y-axis). The graph was prepared with data from all subjects. The flow methods correlated with Pearson coefficient = 0.70. Bottom: comparison of the two methods with a Bland-Altman plot. There are both fixed and proportional biases but no nonuniformities of error.

