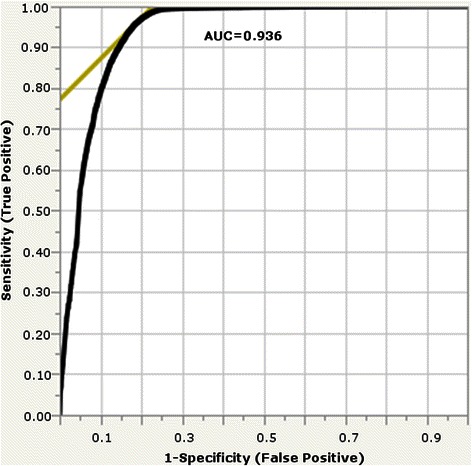
Fig. 3.

Multinomial ROC Curve for 5-fold cross validation on humsavar dataset. The multinomial ROC curve (black curve) is an average of 5 ROC curves which each represent the pathogenicity prediction accuracy of GESPA after training on four folds of humsavar and testing on the remaining fold. The WPC Score, PSIC Score, and nsSNPs for literature were used as predictors for pathogenicity. Using the point of maximum balanced accuracy (intersection of yellow line and black curve) for each curve, the optimal cutoff points of the WPC and PSIC Score for each fold could be determined and the AUC was found to be 0.936
