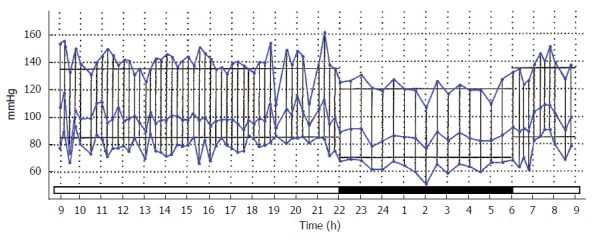
Figure 1.

Ambulatory blood pressure recording showing a normal night time dip. In all the ambulatory blood pressure monitoring tracings, the systolic, diastolic, and mean pressures are shown in blue. The pressure scale in mmHg is on the vertical Y-axis on the left and the time scale in hours is on the horizontal X-axis. The duration of sleep corresponding to the night time period is indicated by a heavy black bar.
