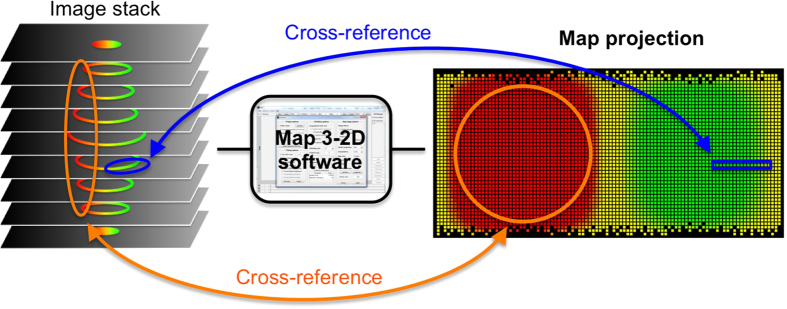
Figure 1. Schematic representation of the of Map3-2D software application.

Fluorescence microscopy 3D (up to 5D) image stacks (left) serve as input for the Map3-2D software (middle). The whole surface data of the object of interest is projected onto a 2D map image (right). Map3-2D software registers all pixel information of the image stack (intensity, position within the stack, position with respect to the reference ellipsoid). Regions of interest corresponding to single (blue lines) or multiple layers (orange lines) of the image stack can be selected on the map projection for cross-referencing and quantitative analysis on the original data, and vice versa.
