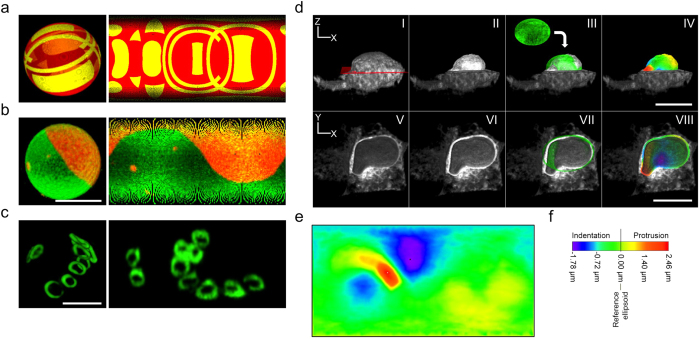
Figure 2. Map projections of surfaces for intensity and shape displays.
(a–c) Map projections (right) from image stacks showing the full surface intensity information of (a) an artificially created 3D object, (b) a GUV and (c) bud scars of a yeast cell. Front views of texture-based volume renderings are shown as reference (left). (d,e) Equirectangular map projection as shape descriptor. (d) Lateral XZ (top row) and axial XY (bottom row) views of volume renderings of the CD3δ-GFP ER signal in a NRK cell. All ER signal above a mid vertical section (red layer shown in d.I) was removed by image processing to reveal the shape of the nucleus in full (top row) or in half (bottom row). A reference ellipsoid (d.III,d.VII) was projected onto the nucleus as elevation reference for the map projection. (e) Map projection as height map for the whole surface of the nucleus shown in (d.II-d.VIII). Deviations from the reference in form of protrusions and indentations are accurately displayed by color-coding (f). All projections shown are Equirectangular maps, displayed either pixel-interpolated (c,e), or not (a,b). Scale bars, 5 μm (b,c), 10 μm (d).

