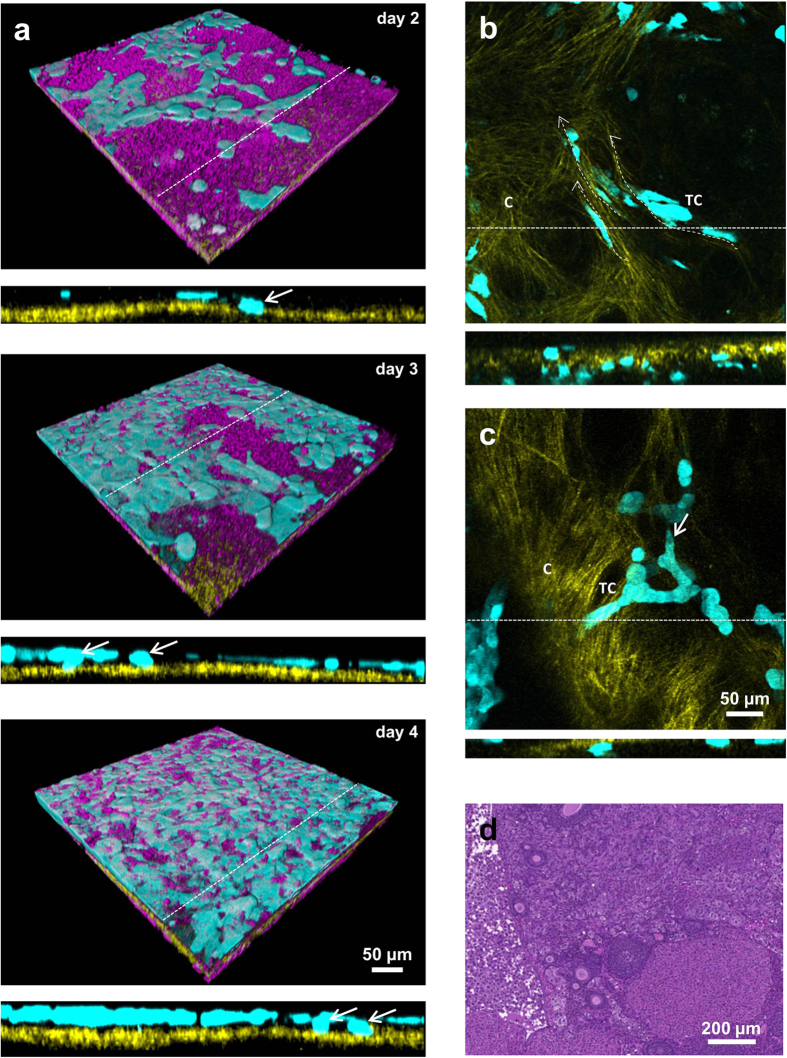
Figure 6. Stages of tumor infiltration into the ovary.
(a) 3D projection of the same field of view imaged over period of 3 days (day 2–4 after xenotransplantation), showing spread of tumor cells above the mesothelial layer. Orthogonal sections (marked with dashed line) show the infiltration of tumor cells into the basement membrane underlying the mesothelial layer (not shown for clarity). (b) Optical section showing the tumor cells extended along the direction of the collagen fibers (dashed arrows). Corresponding orthogonal section (marked with dashed line) showing distribution of tumor cells across the basement membrane. (c) Maximum intensity projection showing tumor cells migrating as multicellular strand led by the tip cell (white arrow). Orthogonal view (dashed line) of the same field of view shows the attachment of the cellular strand into the basement membrane. (d) Hematoxilin – eosin stained histopathological section of the ovary infiltrated with the tumor cell, 14 days after xenotransplantation. C – collagen, TC – tumor cells. Magenta – NADH, yellow – second harmonic generation, cyan – eGFP. All images were acquired in-vivo using the imaging window.

