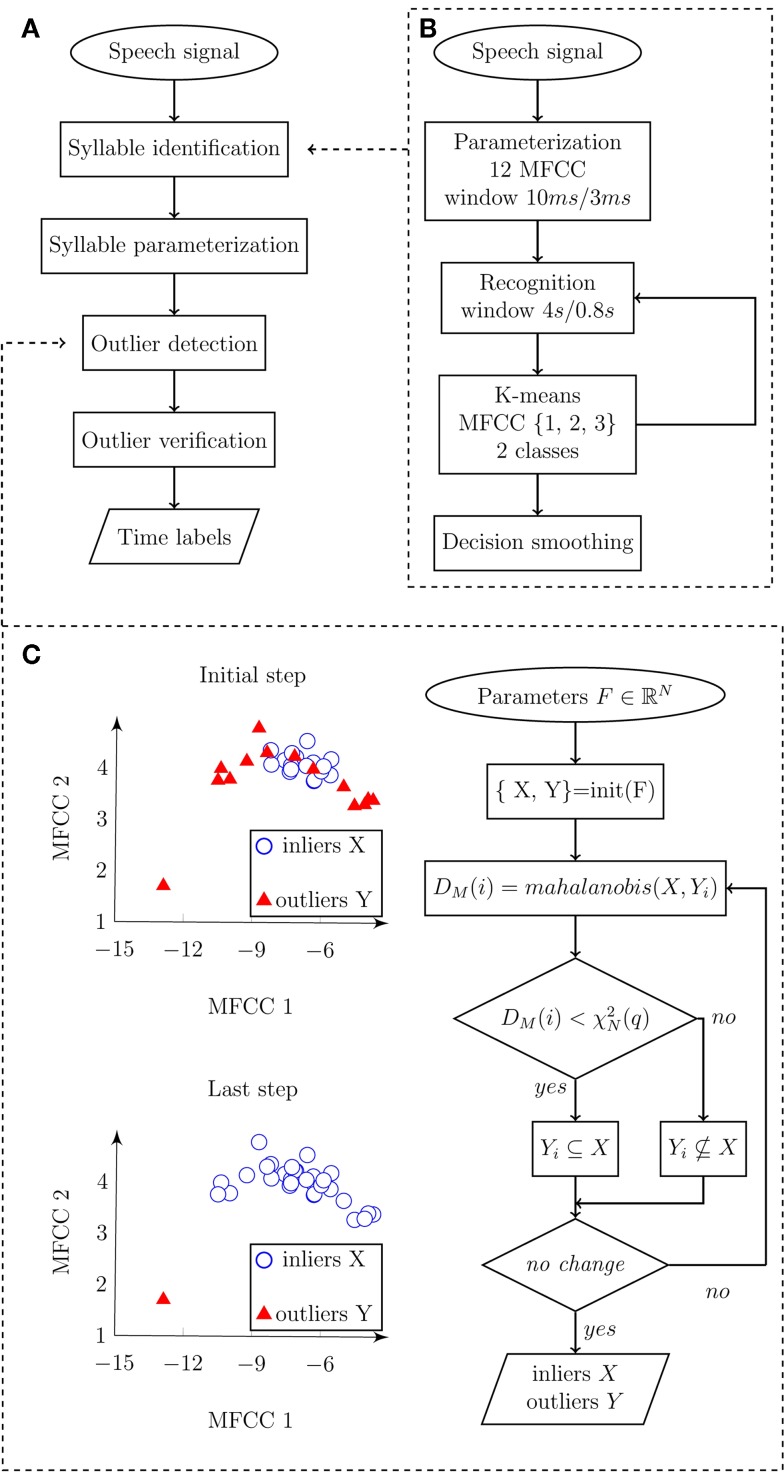
Figure 2.
Flowchart diagram depicting an automatic algorithm for syllable detection. (A) Main diagram describing the principle steps of syllables detection. Input represents speech signal, and output represents time labels related to individual syllable vocalizations. (B) Detail of syllable identification procedure. Input speech signal is parameterized and subsequently classified into speech/pause classes. Output of the algorithm represents detected syllable boundaries. (C) Details of outlier detection. Input is represented by syllables parameterized in three-dimensional space F using the first three MFCC, where X represents inliers (detected syllables), Y represents outliers (non-speech sounds), DM(i) is Mahanalobis distance of observation i, is the value of two degrees of freedom in quantile q. Output consists of marked inliers and outliers.

