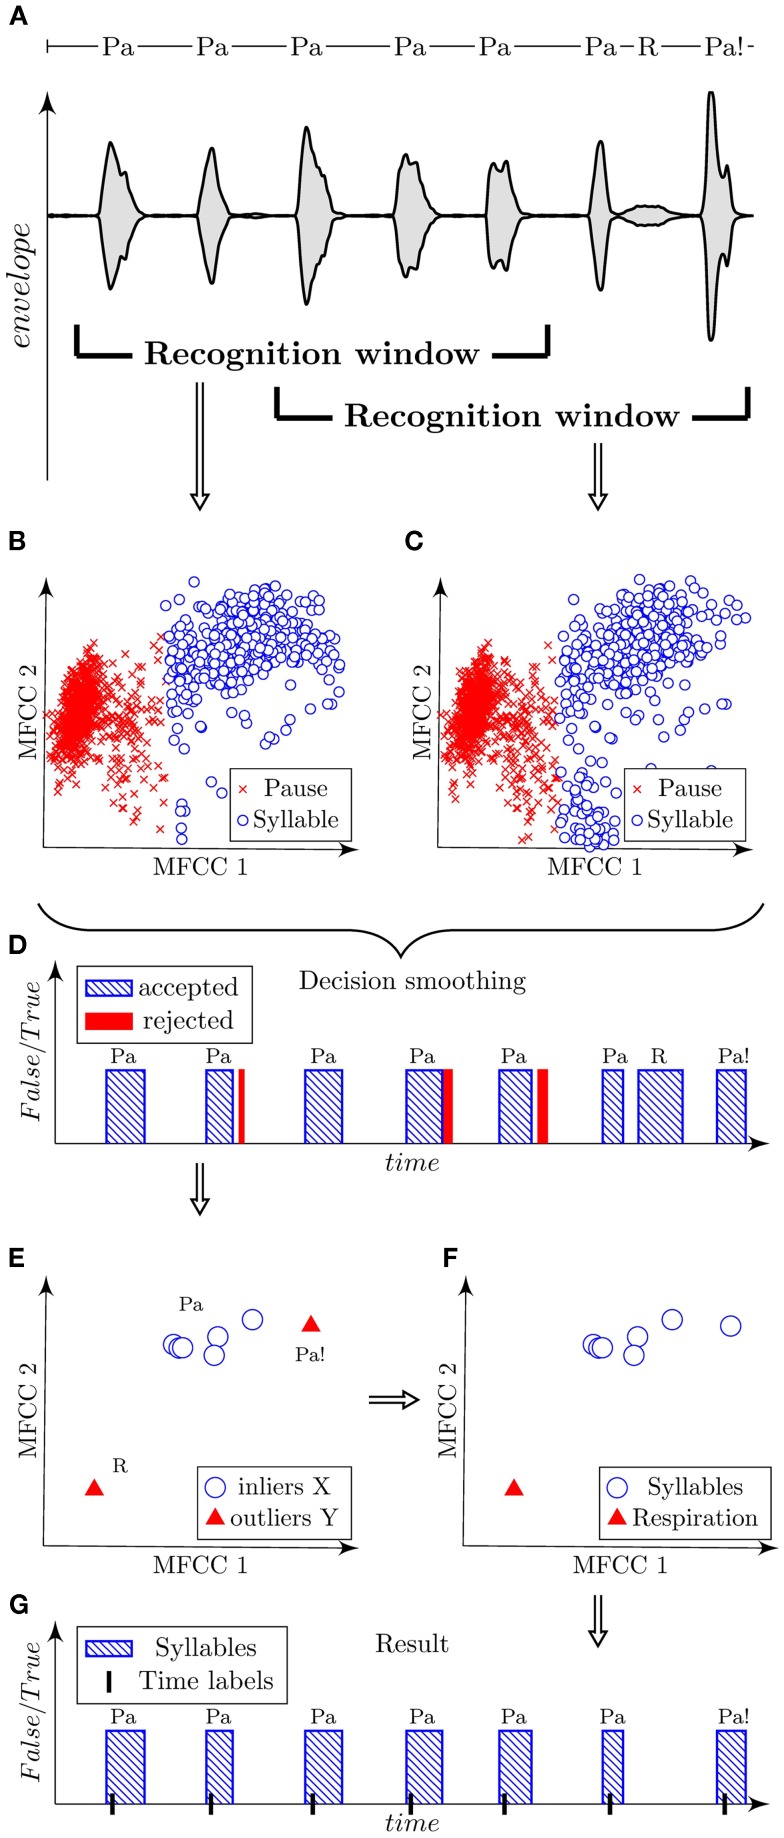
Figure 3.
Illustration of automatic algorithm for the detection of syllables using a sample of dysarthric speech containing syllables “Pa,” respirations “R,” and dissimilarly articulated syllables “Pa!.” Signal is shown using the oscillographic sound pressure envelope with marked positions of the recognition window (A). Classified parametric space of the first three MFCC is plotted in scatter diagrams for each corresponding position of the recognition window (B,C). Decision smoothing of classified signal is plotted in graph with marking of rejected detections (D). Parameterized syllables and highlighted detected outliers are shown in scatter diagram (E). Verified outliers are illustrated in scatted diagram (F). Final result is shown in graph with marked time labels related to highest energy peak of each syllable (G).

