
Fig. 13.
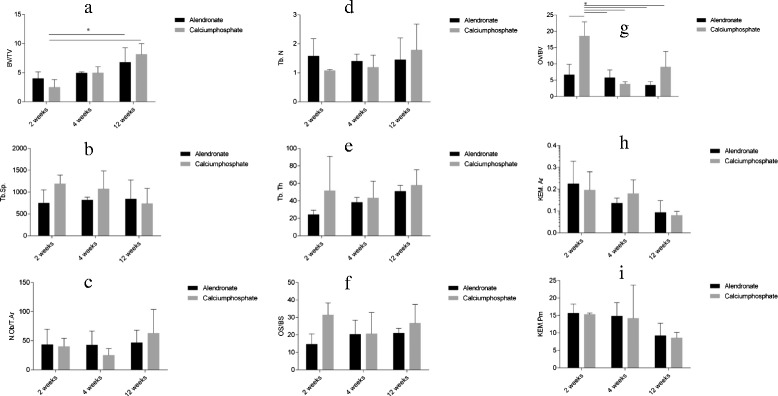
Graphical evaluation of the tissue reaction after 2, 4, and 12 weeks: a BV/TV bone volume per tissue volume, b Tb.Sp trabecular separation, c N.Ob/T.Ar number of osteoblasts per tissue area, d Tb.N trabecular number, e Tb.Th trabecular thickness, f OS/BS osteoid surface per bone surface, g OV/BV osteoid volume per bone volume, h KEM.Ar bone graft substitute per area, and i KEM.Pm bone graft substitute surface density