Fig. 5.

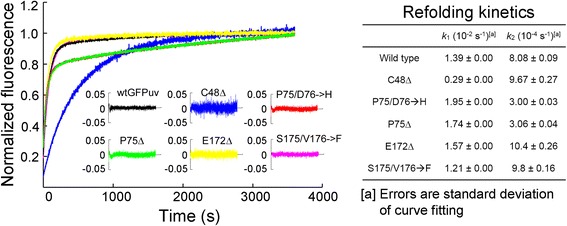
Refolding kinetics. Left panel, kinetic spectra of refolding process. Residuals of curve fitting are shown in the insert. Right panel, fast (k 2) and slow (k 2) folding rates, determined by Prism

Refolding kinetics. Left panel, kinetic spectra of refolding process. Residuals of curve fitting are shown in the insert. Right panel, fast (k 2) and slow (k 2) folding rates, determined by Prism