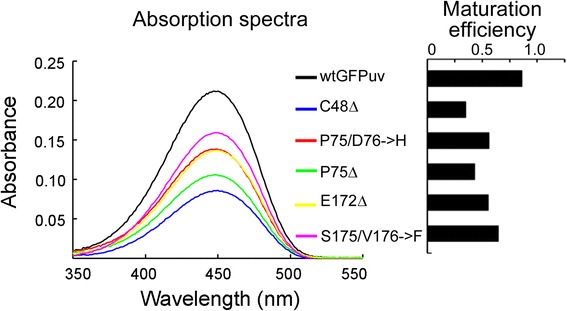
Fig. 6.

Efficiency of chromophore maturation. Left panel, absorbance of wtGFPUV and variants under base-denatured condition. Right panel, efficiency of chromophore maturation, derived from the absorbance data. Three measurement replicates were performed. Standard deviation is within instrumental error (2 %) and thus not shown in the figure
