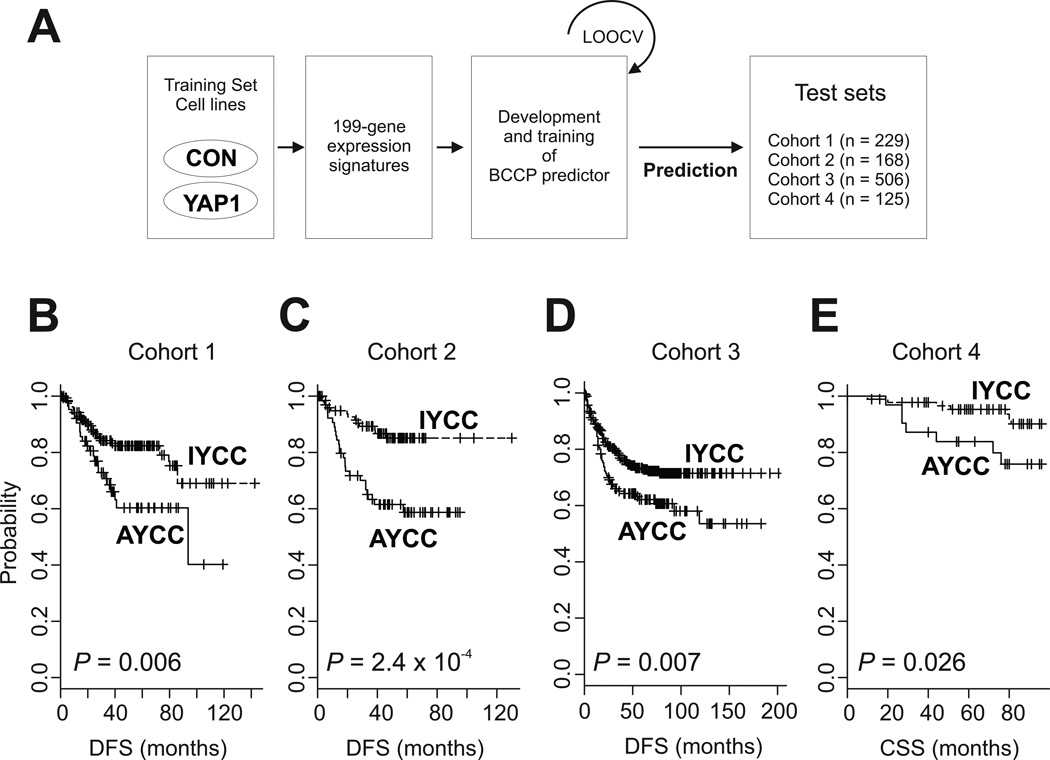
Figure 1.
Construction of a prediction model using gene expression profiles for NCI-H716 cells and analyses of survival in patient cohorts 1–4. (A) Schematic of the strategy used to construct the prediction model and evaluate predicted CRC outcomes according to gene expression signature. CON, control. (B-E) Kaplan-Meier plots of the AYCC and IYCC patients in cohorts 1–4. P values were calculated using log-rank tests. +, censored data.

