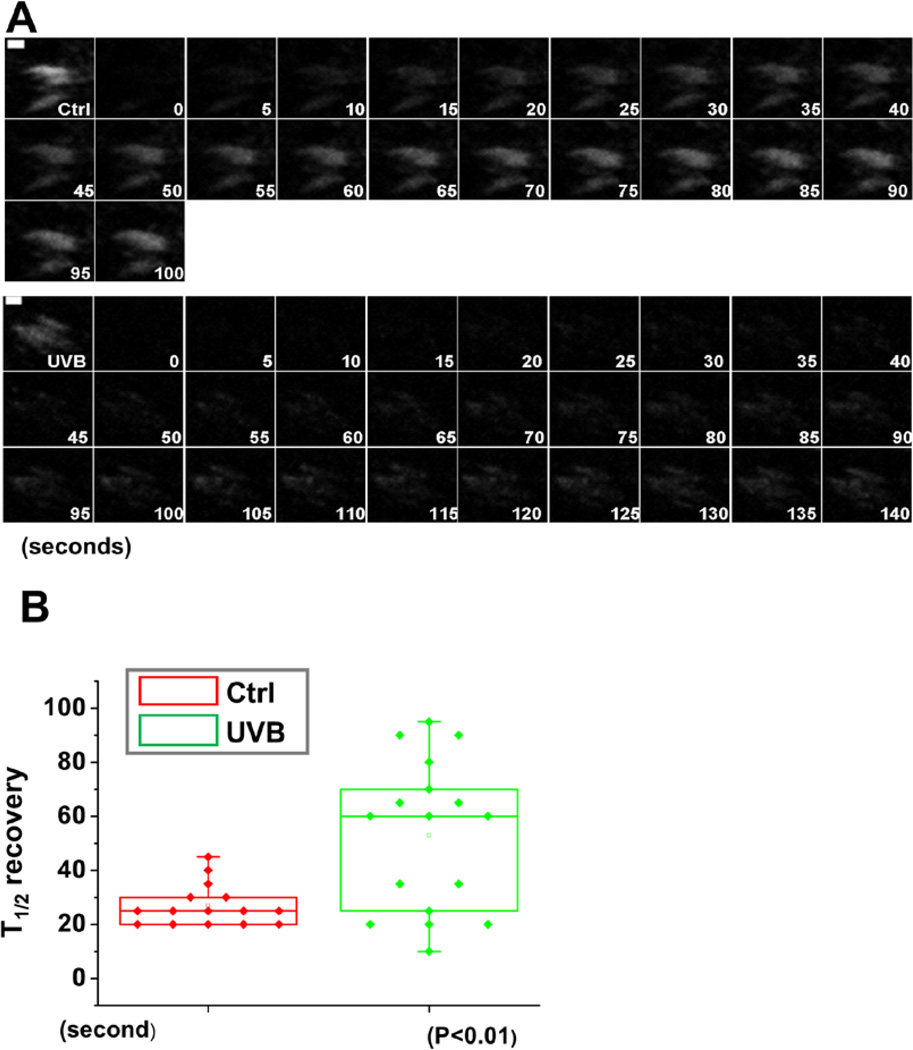
Figure 5. UVB effects on FA dynamics by FRAP.
(A) Fluorescence recovery after photobleaching (FRAP) was used to visualize reduced dynamics of focal adhesions in UVB treated vs untreated cells expressing DsRed-Zyxin. Fluorescence recovery was recorded for 100 s after photobleaching. Representative time-lapse images (montage) of focal adhesions are shown. Scale bar represents 1 µm. (B) Box-and-whisker diagram quantifying the differences in half-time (T1/2) of FRAP between control and UVB treated cells.

