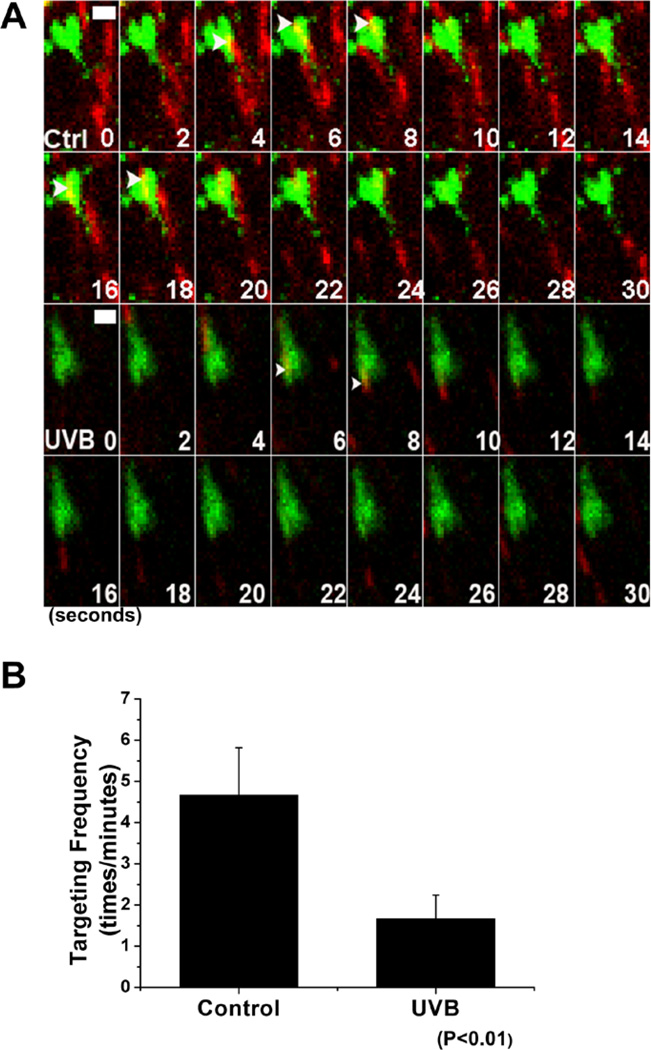
Figure 7. UVB effects on MT targeting to FA.
(A) Representative time-lapse images (montages) of keratinocytes expressing GFP-Paxillin and TaqRed-EB1 show MT plus-end growth (red) toward FAs (green). The scale bar represents 1 µm. (B) Behavior of MT targeting to FAs was manually traced, and targeting frequencies to individual FAs were quantified and depicted by bar graph. Note the significant alterations in the ability of MTs targeting to FAs in UVB treatment.

