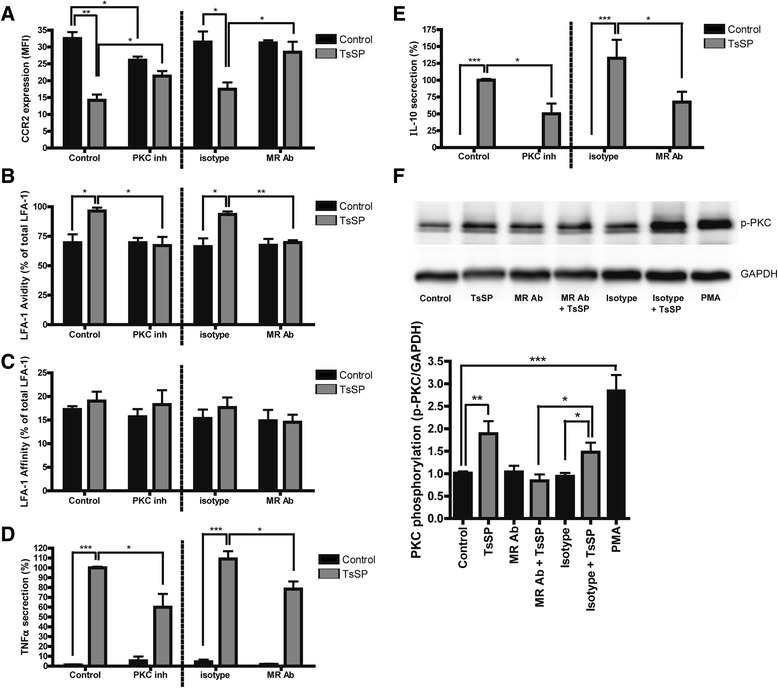
Fig. 6.

PKC signals downstream upon TsSP-MR interaction. Quantification of flow cytometry analysis of the expression levels of (a) CCR2, (b) LFA-1 avidity and (c) LFA-1 affinity on human monocytes. These cells were cultured in the presence or absence of TsSP (40 μg/ml, 16 h), the PKC inhibitor Bisindolylmaleimide I (GF109203, 2 μM) and blocking antibodies for the MR or its isotype control (both 10 μg/ml). (b) and (c) are expressed as the percentage of avidity/affinity compared to total LFA-1. Cell supernatants were used to determine the levels of (d) TNF-α and (e) IL-10 secretion by enzyme-linked immunosorbent assay analysis. f PKC activation was determined by Western Blotting using phosphoPKC antibodies compared to GAPDH expression and images were subsequently quantified using ImageJ. Experiments were performed in triplicate using cells derived from 4 different human donors and the results are presented as the mean (a-c); the mean percentage (d, e) or the mean PKC phosphorylation +/− SEM. *p < 0.05, **p < 0.01, ***p < 0.001 as determined by ANOVA and Students t test
