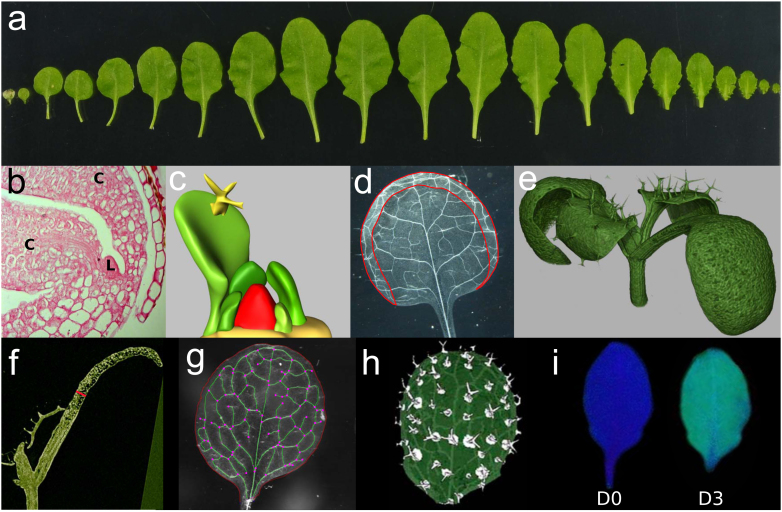
Figure 3.
Quantitative phenotyping of the rosette leaf.
(a) Heteroblasty within an Arabidopsis rosette (accession C24). At the left, two embryonic cotyledons precede the true leaves; leaves are arranged from left to right in order of emergence from the SAM. (b) The first leaves (L) appear between the two cotyledons (C) at 3 DAS. (c) Using 3D reconstructions of leaf primordia, volumes of primordia that are otherwise difficult to access can be measured, (d) Transparent ethanol-cleared leaves allow visualization of the vasculature and more accurate measurements of leaves with a strong blade curvature (red), (e) Using HRXCT scanning, 3D representations of seedlings and leaves can be reconstructed from optical sections (f) in which leaf thickness (red) can be measured, (g) Total vascular system (green), branching points (purple dots) and the leaf perimeter (red) can be extracted semi-automatically from cleared leaves, (h) Trichome extraction and patterning in a developing leaf using optical projection tomography (OPT) (Lee et al., 2006). (i) The photochemical efficiency of PSII of leaves is high before a dark treatment (D0), represented by the dark-blue color. After 3 days of dark induced senescence (D3) treatment, this photochemical efficiency is lower, visualized by the light-blue color and yellow patches.

