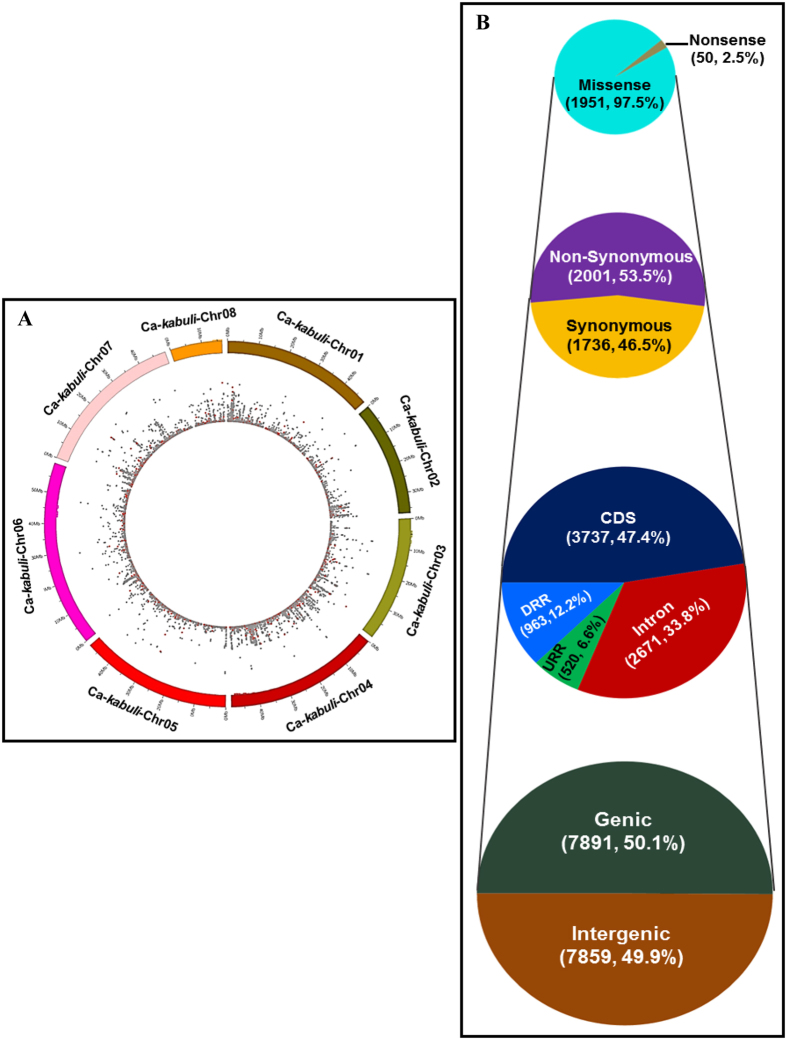
Figure 1. Genomic distribution and relative frequency of 11989 GBS-based SNPs structurally annotated on chickpea genome/genes.
(A). The distribution of 11989 GBS-based genome-wide SNPs physically mapped on eight kabuli chickpea chromosomes is illustrated in the Circos circular ideogram. The outermost and innermost circles represent the different colours-coded chromosomes and distribution of SNPs, including non-synonymous SNPs (marked with red dots), respectively. (B) Frequency distribution of 15750 GBS-based SNPs mined in the intergenic regions and diverse coding and non-coding sequence components of 3371 genes annotated from kabuli genome. Number and proportion of SNPs, including synonymous and non-synonymous SNPs annotated in the coding as well as non-coding intronic and regulatory sequences of kabuli chickpea genes and intergenic regions are depicted. The URR (upstream regulatory region) and DRR (downstream regulatory region) of genes were defined as per the gene annotation information of kabuli genome (Varshney et al.6).

