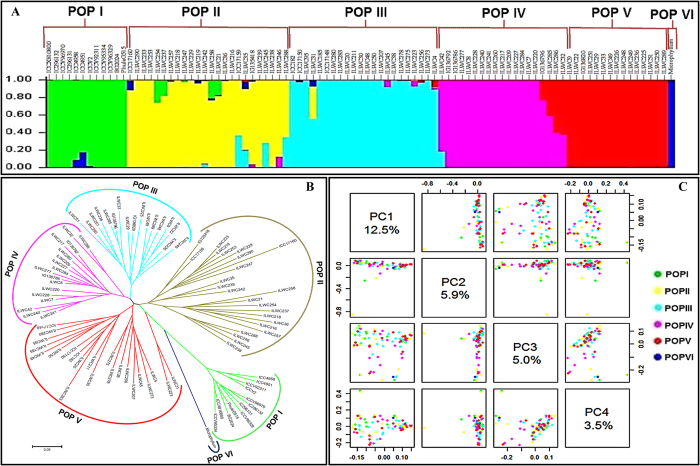
Figure 2. Genome-wide SNP-based molecular diversity, phylogeny and population genetic structure among 93 wild and cultivated Cicer accessions.
(A) Population genetic structure among 93 wild and cultivated accessions using 27862 genome-wide SNPs. These SNPs assigned 93 accessions into six populations (POP I, POP II, POP III, POP IV, POP V and POP VI) that majorly grouped as per their species and gene pools of origination. The accessions represented by vertical bars along the horizontal axis were classified into K colour segments based on their estimated membership fraction in each K cluster. Six diverse colours represent different population groups based on optimal population number K = 6. (B) Unrooted phylogram illustrating the genetic relationships (Nei’s genetic distance) among 93 wild and cultivated accessions belonging to seven Cicer species using 27862 genome-wide SNPs. The phylogenetic tree clearly differentiated 93 accessions into six diverse groups, which correspond to their species and gene pools of origination. (C) Principal component analysis (PCA) differentiating the 93 wild and cultivated accessions belonging to seven Cicer species into six populations (POP I, POP II, POP III, POP IV, POP V and POP VI) as determined by population genetic structure. The PC1, PC2, PC3, PC4, PC5 and PC6 explained 10.2%, 7.8%, 3.7%, 3.4%, 2.7%, 2.4% and 2.3% of the total variance, respectively.

