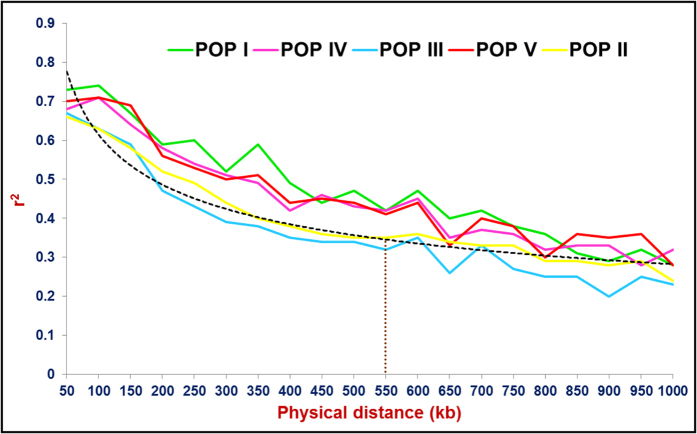
Figure 3. LD decay (mean r2) estimated in five structured populations (POP I–POP V) using 11989 kabuli genome (chromosome)-derived GBS-SNPs.
The average r2 estimated among SNPs spaced with uniform 50 kb physical intervals from 0 to 1000 kb are illustrated by the plotted curved lines. The LD decay for POP VI could not be calculated due to inclusion of only one wild accession within this population group. The dotted lines were plotted between pooled r2 (across entire five populations) and physical distance (kb) based on nonlinear regression model considering the r2 = 1 at marker physical distance of 0 kb and the trend of LD decay were estimated in wild and cultivated Cicer accessions.

