
Fig. 1.
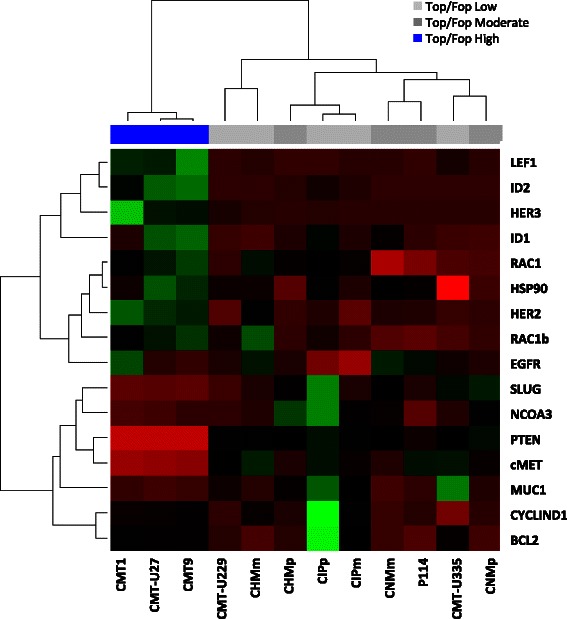
Cluster analysis of different canine mammary cell lines with their relative basal gene expression. RNA from 12 different canine mammary cancer cell lines was isolated and quantitative RT-PCR was done for several target and reference genes on their cDNA. RT-PCR data were analyzed in RStudio with the Pearson:Spearman test and graphically presented with their corresponding TOP/FOP ratios (blue >30; dark grey 2-6; light grey <2) as published previously [5]. The three cell lines with high basal TOP/FOP ratios (canonical Wnt pathway) cluster together in the non-hierarchical cluster analysis. Green is a high expressed gene and red is low expressed gene