
Figure 4.
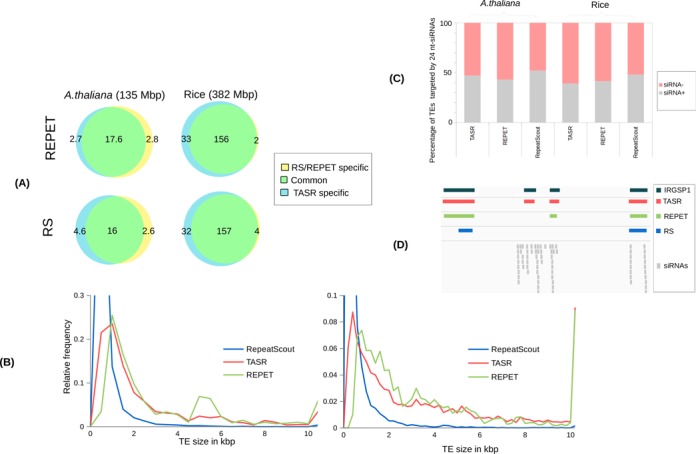
Comparison of TE annotations obtained by TASR with RepeatScout and REPET. (A) Venn diagrams showing the common and specific TE fractions in Mbp obtained using TASR and RepeatScout/REPET. Blue is TASR-specific TEs, green common TEs and yellow RepeatScout/REPET-specific TEs. (B) Relative frequency distribution of library length in kbp generated by RepeatScout, REPET and TASR. Note the relative frequency was limited in Y-axis to facilitate comparisons. (C) Comparison of the percentage of TEs targeted by 24 nt-siRNAs between TASR, REPET and RepeatScout. (D) Genome Browser screenshot showing representative example of TE annotation obtained by TASR, REPET and RepeatScout.