Figure 1.

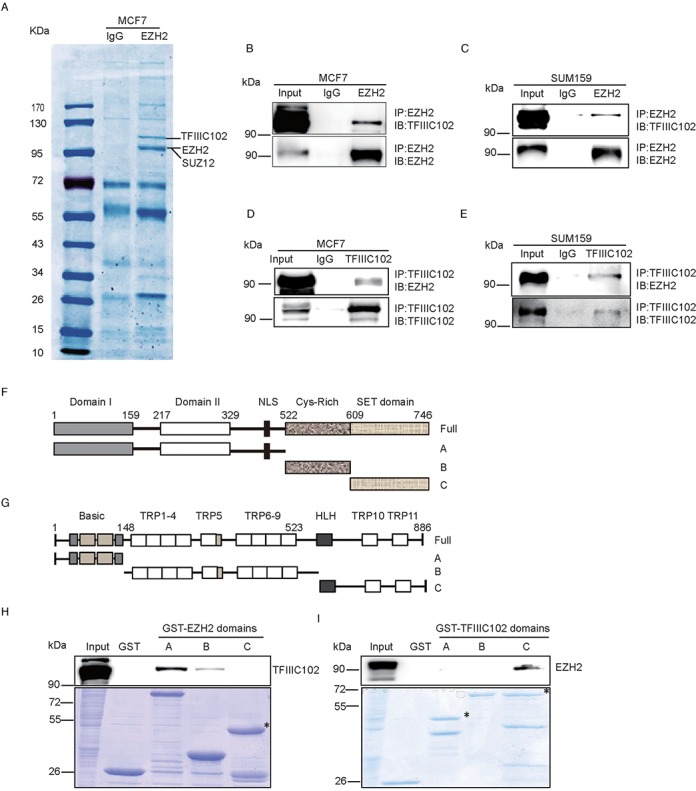
EZH2 interacts with TFIIIC102 in breast cancer cells. (A) SDS-PAGE gel showing proteins co-immunoprecipitated by IgG and an EZH2 antibody from MCF7 cells. The gel was stained by Coomassie brilliant blue and differential bands were subjected for mass spectrometry. Bands indicated showed TFIIIC, EZH2 and SUZ12 after determination by mass spectrometry. (B and C) Co-IP assays performed with an EZH2 antibody and analyzed by western blot using lysates from MCF7 and SUM159 cells with indicated antibodies. (D and E) Reverse Co-IP with TFIIIC102 antibody and analyzed by western blot using lysates from MCF7 and SUM159 cells with indicated antibodies. Rabbit or mouse IgG was used as negative controls. (F) Organization of the EZH2 functional domains. Three GST–EZH2 fragments were constructed: A. N-terminal region (Domain I + Domain II): aa 1–522. B. Middle region (Cys domain): aa 523–605. C. C-terminal region (SET Domain): aa 606–746. (G) Organization of the domains of TFIIIC102. Three GST–TFIIIC102 fragments were constructed: A.N-terminal region: aa 1–148. B. Middle region: aa 149–523. C. C-terminal region: aa 524–886. (H) GST pull-down assays were performed with purified GST–EZH2 fragments and HeLa cell lysates. Protein interaction was detected by western blot with TFIIIC102 antibody. The asterisk indicates the fragment C of GST–EZH2. (I) GST pull-down assays using GST–TFIIIC102 fragments and HeLa cell lysates were performed. Protein interaction was detected by Western blot with an EZH2 antibody. The asterisks indicate fragments A and C of GST–TFIIIC102 separately. GST alone was used as a negative control.
