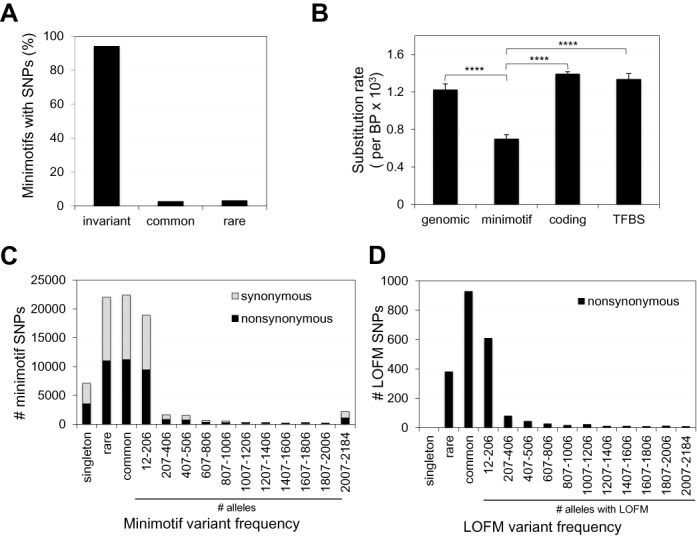
Figure 1.

Minimotifs show functional constraint. (A) Histogram of minimotif conservation. (B) Histogram of substitution rates for different genomic regions including minimotifs [n = 5 (50 000, 12 bp segments)]. **** indicates P < 0.0001 for differences in pairwise comparison to minimotifs SNPs. (C) Stacked Histogram for occurrences of variant SNPs located in minimotifs. Synonymous and nonsynonymous SNPs are shown. (D) Histogram for SNPs that alter the amino acid of a residue that is post-translationally modified (LOFMs). (C and D). The rare variant fraction has a MAF < 1%.
