Figure 2.

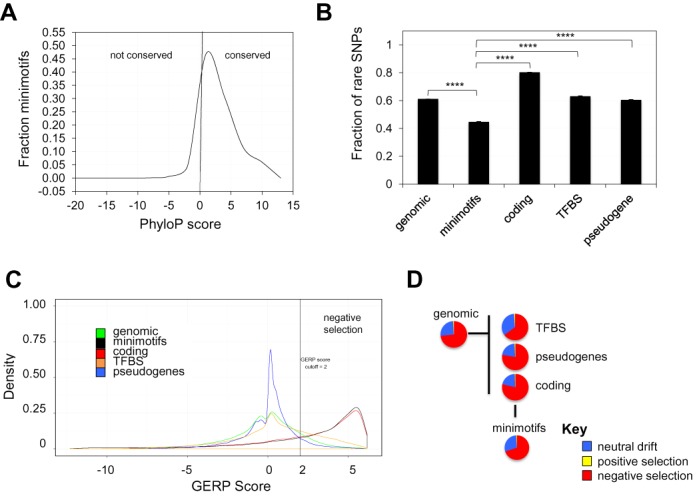
Approximately half of nonsynonymous SNPs for minimotifs have undergone purifying selection. (A) Minimotif conservation plot showing PhyloP scores. (B) Histogram of fraction of rare SNPs for different genomic regions including minimotifs [n = 5 (50 000, 12 bp segments)]. **** indicates P < 0.0001 for differences in pairwise comparison to minimotifs SNPs. (C) Density plots showing the distribution of GERP scores for different genomic regions (see legend). A vertical line indicates the GERP score threshold of 2. (D) Pie graphs showing fraction of genomic elements with types of selection based on the SLR statistic for different genomic regions; see key, SLR < 4 = negative selection, 4 ≤ SLR ≥ 6 = neutral drift, and SLR > 6 = positive selection.
