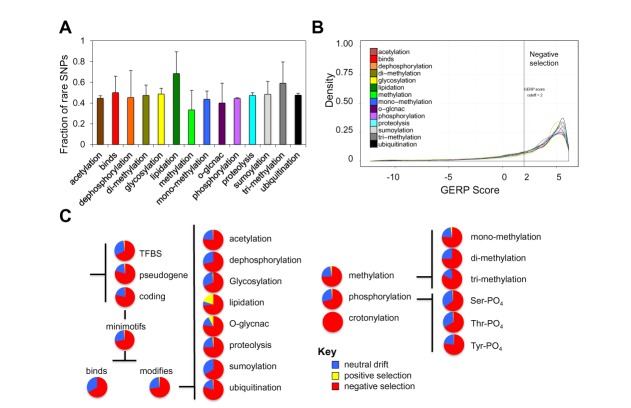
Figure 3.
Some minimotif activities are more prone to selection than others. (A) Histogram of fraction of rare SNPs for different types of minimotifs. (B) Density plot showing the distribution of GERP scores (for different minimotif subactivities (see legends). A vertical line indicates the GERP score threshold of 2 (B). (C) Pie graphs showing the percentages of SNPs in different genomic regions and activity subgroups under neutral, negative, and positive selection as measured by the SLR statistic in Figure 2. Lipidation, O-glcnac, dephosphoryation and crotnylation had small numbers of minimotifs (n < 20).

