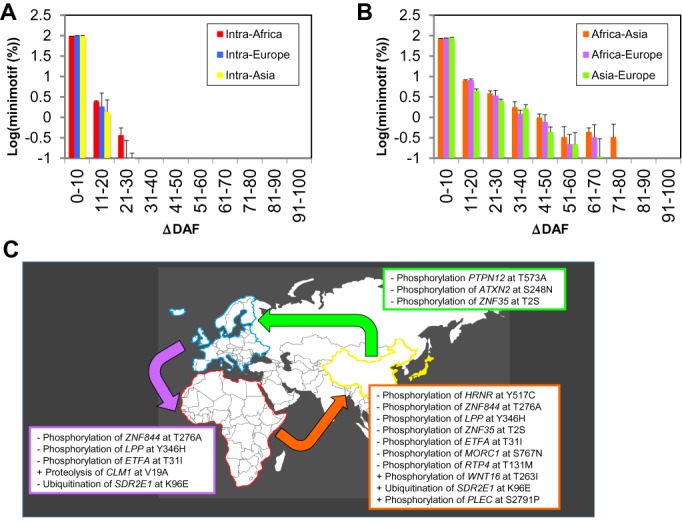
Figure 6.

Minimotif alleles have a variable geographic distribution. Bin plot showing the intracontinental (A) and intercontinental (B) variability of DM and LOFM minimotif alleles. Continents are colored with primary colors and intercontinental relationships with related secondary colors. (A and B) Standard deviations were calculate from populations groups for the continents indicated (African – ASW, YRI, LWK; European – CEU, FIN, GBR, TSI; Asian – CHB, CHS, JPT). Abbreviations for populations are from the 1000 Genomes Project (13). (C) A portion of the world atlas showing different minimotifs with intercontinental ΔDAFs > 50%. The embedded tables show the minimotifs, genes that contain the minimotif, minimotif functions and amino acid changes encoded by missense mutation alleles that have the highest differences between continental populations. Table rows that start with a ‘+’ indicate a DM and those with a ‘–’ indicate a LOFM. Continent and table colors are as in (A) and (B).
