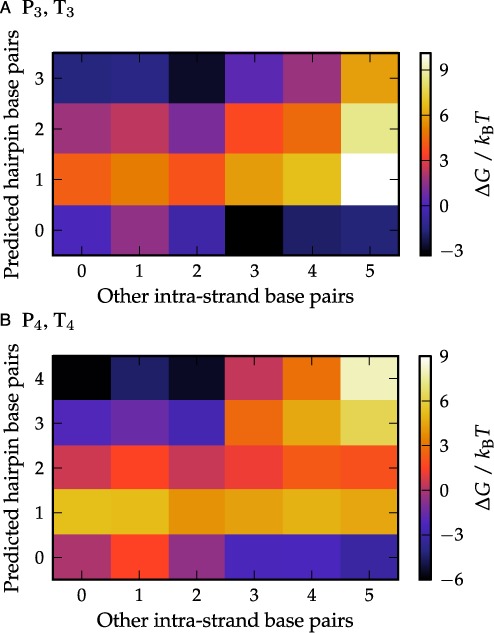
Figure 3.

The free-energy profiles of the P3 and P4 strands are shown in panels (A) and (B), respectively. The free energy of a particular state relative to the unbound (0,0) state is indicated by the color of the square. The results for complementary T strands are essentially identical.
