
Figure 4.
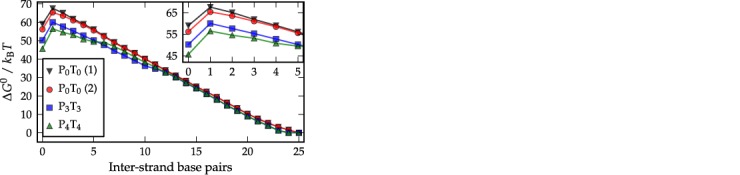
The free-energy profiles for P0T0, P3T3 and P4T4 versus inter-strand base pairs between P and T strands. For P0T0, curve (1) is obtained when hairpin formation is forbidden, and curve (2) is from a simulation without this restriction. Each system was simulated in a box with a volume of 3.96 × 10⁻²³ m−3 at T = 20°C.