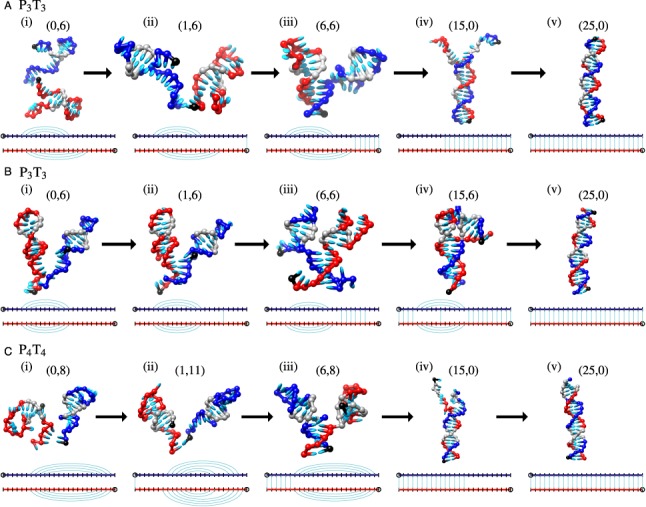
Figure 6.

Typical duplex formation pathways for panels (A) and (B) P3T3, and panel (C) P4T4. Schematic illustrations below each figure indicate hairpin and duplex base pairs present. In panel (A) one intended and one non-intended 3-stem base pair are present just before and after the association event ((i) and (ii)) but have melted by the time the system has formed 15 inter-strand base pairs (iii). In panel (B) both intended 3-stem base pairs are present just before and after the association event ((i) and (ii)), and are still present even once the system has formed 15 inter-strand base pairs (iv). These hairpins must melt before the duplex can be formed (v). In panel (C) both intended 4-stem base pairs are present in (i)-(iii), but have melted by the time the system has formed 15 inter-strand base pairs (iv). The black nucleotides indicate the 3′ end of the strand. Gray nucleotides indicate the locations of the 3-base pair or 4-base pair hairpins present during the association event. The notation (1,6), for example, refers to 1 inter-strand and 6 intra-strand base pairs in the system.
