Figure 9.

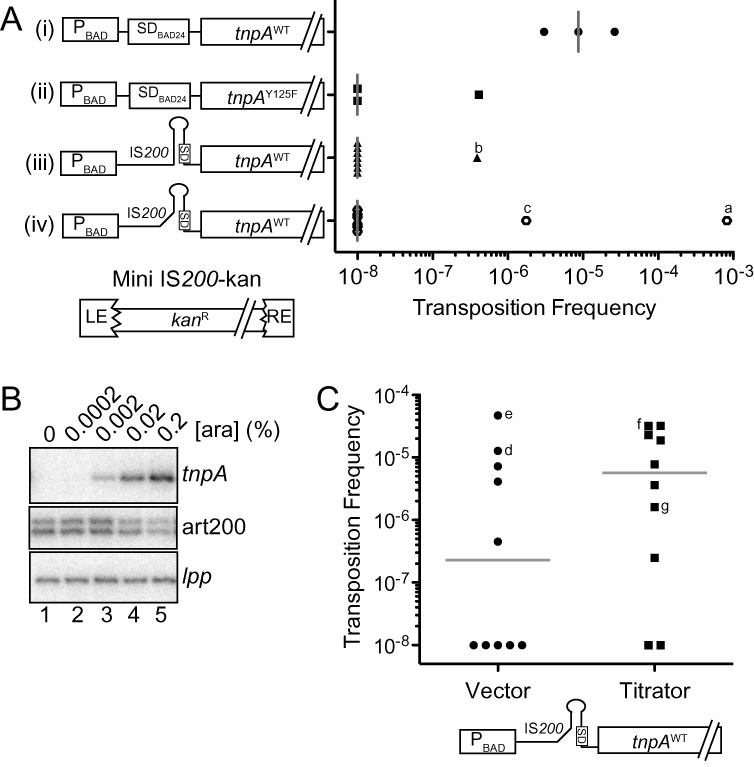
IS200 transposition assays. (A) IS200 transposition frequency was measured using the conjugal mating out assay. Briefly, E. coli (F+; DBH291) containing a single chromosomal copy of a marked IS200 element (mini IS200-kan) was transformed with a plasmid expressing TnpA under the control of various regulatory elements, including the PBAD promoter, the 5'UTR from pBAD24 (includes an optimized SD) and the IS200 5'UTR (constructs i–iv). These ‘donor’ cells were grown in the presence of arabinose (0.2%) to induce tnpA transcription, mixed with an F- recipient strain (DBH13) and then the mating mixes were plated on selective media for measuring mating efficiency (exconjugants) and transposition events (hops). Transposition frequency is the ratio of hop to exconjugant colonies. Transposition frequencies for individual donor clones are presented in scattergram form for each TnpA construct; gray bars show the median transposition frequency for one (constructs i and ii) or three (constructs iii and iv) independent experiments. Clones that did yield hops and were analyzed by Southern blot analysis are indicated (a–c). LE = left end (bp 1–163), RE = right end (bp 566–707) and kanR = kanamycin resistance gene. (B) Primer extension analysis of DBH291 donor cells transformed with construct (iii) and grown to mid-log phase in the presence of arabinose. Primer extension reactions were multiplexed to detect tnpA, art200 and lpp (loading control). (C) Mating out assay with donor strains containing construct (iv) and either the low expression art200 titrator plasmid or an empty vector control. Gray bars show the median transposition frequency for each donor strain from three independent experiments; d, e, f and g are hop colonies subjected to Southern blot analysis (Supplementary Figure S6). In (A) and (C) the transposition frequency for donor clones that did not produce hop colonies was set at 1 × 10⁻⁸.
